Immigrants from Portugal vs Honduran Median Household Income
COMPARE
Immigrants from Portugal
Honduran
Median Household Income
Median Household Income Comparison
Immigrants from Portugal
Hondurans
$84,740
MEDIAN HOUSEHOLD INCOME
44.2/ 100
METRIC RATING
180th/ 347
METRIC RANK
$72,588
MEDIAN HOUSEHOLD INCOME
0.0/ 100
METRIC RATING
305th/ 347
METRIC RANK
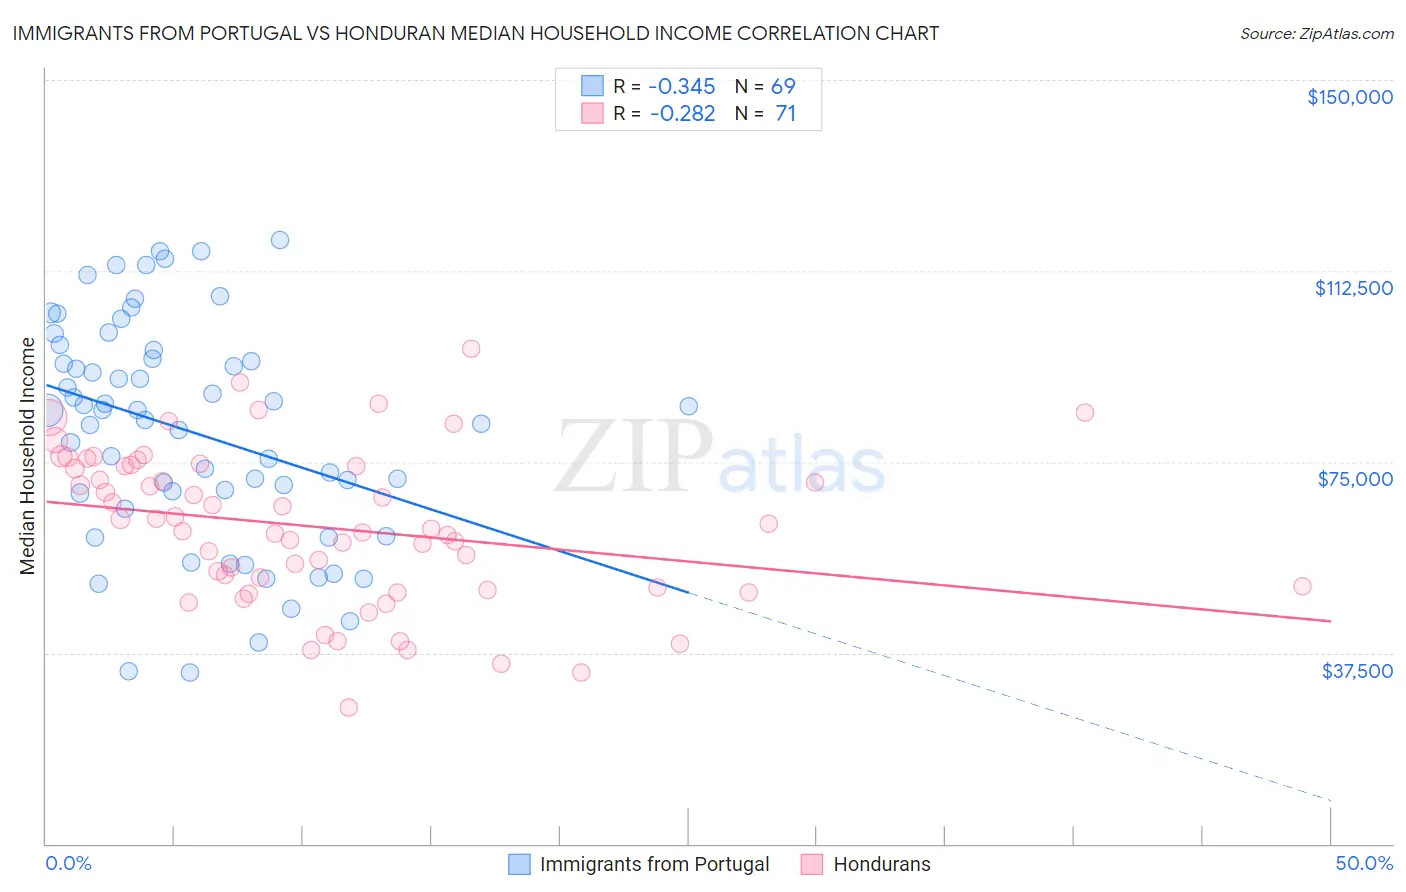
Immigrants from Portugal vs Honduran Median Household Income Correlation Chart
The statistical analysis conducted on geographies consisting of 174,758,543 people shows a mild negative correlation between the proportion of Immigrants from Portugal and median household income in the United States with a correlation coefficient (R) of -0.345 and weighted average of $84,740. Similarly, the statistical analysis conducted on geographies consisting of 357,531,795 people shows a weak negative correlation between the proportion of Hondurans and median household income in the United States with a correlation coefficient (R) of -0.282 and weighted average of $72,588, a difference of 16.7%.
Median Household Income Correlation Summary
| Measurement | Immigrants from Portugal | Honduran |
| Minimum | $33,750 | $26,822 |
| Maximum | $118,667 | $97,304 |
| Range | $84,917 | $70,482 |
| Mean | $80,926 | $62,141 |
| Median | $85,116 | $61,786 |
| Interquartile 25% (IQ1) | $67,289 | $50,302 |
| Interquartile 75% (IQ3) | $96,142 | $74,115 |
| Interquartile Range (IQR) | $28,853 | $23,813 |
| Standard Deviation (Sample) | $21,750 | $15,104 |
| Standard Deviation (Population) | $21,592 | $14,997 |
Similar Demographics by Median Household Income
Demographics Similar to Immigrants from Portugal by Median Household Income
In terms of median household income, the demographic groups most similar to Immigrants from Portugal are Hawaiian ($84,729, a difference of 0.010%), Uruguayan ($84,691, a difference of 0.060%), Spaniard ($84,644, a difference of 0.11%), English ($84,915, a difference of 0.21%), and Czechoslovakian ($84,965, a difference of 0.27%).
| Demographics | Rating | Rank | Median Household Income |
| Immigrants | Cameroon | 53.4 /100 | #173 | Average $85,314 |
| Scottish | 50.0 /100 | #174 | Average $85,101 |
| Immigrants | Costa Rica | 49.2 /100 | #175 | Average $85,054 |
| Alsatians | 49.2 /100 | #176 | Average $85,053 |
| Immigrants | Eritrea | 48.8 /100 | #177 | Average $85,025 |
| Czechoslovakians | 47.8 /100 | #178 | Average $84,965 |
| English | 47.0 /100 | #179 | Average $84,915 |
| Immigrants | Portugal | 44.2 /100 | #180 | Average $84,740 |
| Hawaiians | 44.1 /100 | #181 | Average $84,729 |
| Uruguayans | 43.5 /100 | #182 | Average $84,691 |
| Spaniards | 42.7 /100 | #183 | Average $84,644 |
| Immigrants | Eastern Africa | 37.4 /100 | #184 | Fair $84,299 |
| Kenyans | 34.2 /100 | #185 | Fair $84,085 |
| Puget Sound Salish | 33.2 /100 | #186 | Fair $84,011 |
| Belgians | 33.2 /100 | #187 | Fair $84,008 |
Demographics Similar to Hondurans by Median Household Income
In terms of median household income, the demographic groups most similar to Hondurans are Immigrants from Haiti ($72,599, a difference of 0.020%), Potawatomi ($72,576, a difference of 0.020%), African ($72,650, a difference of 0.090%), Shoshone ($72,660, a difference of 0.10%), and Cherokee ($72,682, a difference of 0.13%).
| Demographics | Rating | Rank | Median Household Income |
| Paiute | 0.0 /100 | #298 | Tragic $72,959 |
| Indonesians | 0.0 /100 | #299 | Tragic $72,856 |
| Immigrants | Dominica | 0.0 /100 | #300 | Tragic $72,760 |
| Cherokee | 0.0 /100 | #301 | Tragic $72,682 |
| Shoshone | 0.0 /100 | #302 | Tragic $72,660 |
| Africans | 0.0 /100 | #303 | Tragic $72,650 |
| Immigrants | Haiti | 0.0 /100 | #304 | Tragic $72,599 |
| Hondurans | 0.0 /100 | #305 | Tragic $72,588 |
| Potawatomi | 0.0 /100 | #306 | Tragic $72,576 |
| Ute | 0.0 /100 | #307 | Tragic $72,402 |
| Yakama | 0.0 /100 | #308 | Tragic $72,225 |
| Immigrants | Caribbean | 0.0 /100 | #309 | Tragic $71,860 |
| U.S. Virgin Islanders | 0.0 /100 | #310 | Tragic $71,853 |
| Immigrants | Zaire | 0.0 /100 | #311 | Tragic $71,801 |
| Immigrants | Honduras | 0.0 /100 | #312 | Tragic $71,452 |