Immigrants from Portugal vs Immigrants from Yemen Median Household Income
COMPARE
Immigrants from Portugal
Immigrants from Yemen
Median Household Income
Median Household Income Comparison
Immigrants from Portugal
Immigrants from Yemen
$84,740
MEDIAN HOUSEHOLD INCOME
44.2/ 100
METRIC RATING
180th/ 347
METRIC RANK
$65,194
MEDIAN HOUSEHOLD INCOME
0.0/ 100
METRIC RATING
338th/ 347
METRIC RANK
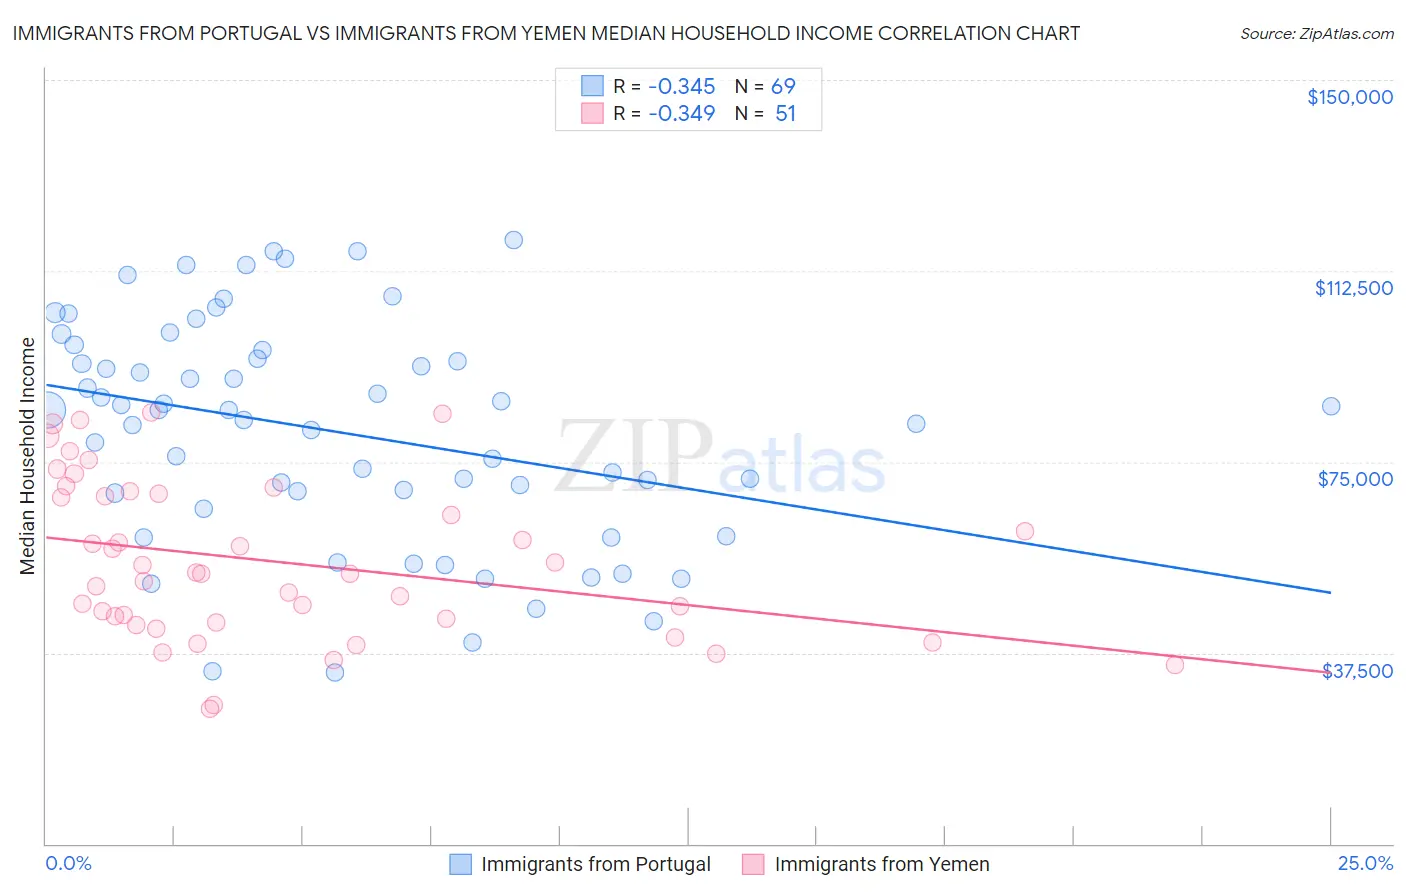
Immigrants from Portugal vs Immigrants from Yemen Median Household Income Correlation Chart
The statistical analysis conducted on geographies consisting of 174,758,543 people shows a mild negative correlation between the proportion of Immigrants from Portugal and median household income in the United States with a correlation coefficient (R) of -0.345 and weighted average of $84,740. Similarly, the statistical analysis conducted on geographies consisting of 82,433,611 people shows a mild negative correlation between the proportion of Immigrants from Yemen and median household income in the United States with a correlation coefficient (R) of -0.349 and weighted average of $65,194, a difference of 30.0%.
Median Household Income Correlation Summary
| Measurement | Immigrants from Portugal | Immigrants from Yemen |
| Minimum | $33,750 | $26,635 |
| Maximum | $118,667 | $84,689 |
| Range | $84,917 | $58,054 |
| Mean | $80,926 | $55,369 |
| Median | $85,116 | $53,125 |
| Interquartile 25% (IQ1) | $67,289 | $43,348 |
| Interquartile 75% (IQ3) | $96,142 | $68,707 |
| Interquartile Range (IQR) | $28,853 | $25,359 |
| Standard Deviation (Sample) | $21,750 | $15,452 |
| Standard Deviation (Population) | $21,592 | $15,299 |
Similar Demographics by Median Household Income
Demographics Similar to Immigrants from Portugal by Median Household Income
In terms of median household income, the demographic groups most similar to Immigrants from Portugal are Hawaiian ($84,729, a difference of 0.010%), Uruguayan ($84,691, a difference of 0.060%), Spaniard ($84,644, a difference of 0.11%), English ($84,915, a difference of 0.21%), and Czechoslovakian ($84,965, a difference of 0.27%).
| Demographics | Rating | Rank | Median Household Income |
| Immigrants | Cameroon | 53.4 /100 | #173 | Average $85,314 |
| Scottish | 50.0 /100 | #174 | Average $85,101 |
| Immigrants | Costa Rica | 49.2 /100 | #175 | Average $85,054 |
| Alsatians | 49.2 /100 | #176 | Average $85,053 |
| Immigrants | Eritrea | 48.8 /100 | #177 | Average $85,025 |
| Czechoslovakians | 47.8 /100 | #178 | Average $84,965 |
| English | 47.0 /100 | #179 | Average $84,915 |
| Immigrants | Portugal | 44.2 /100 | #180 | Average $84,740 |
| Hawaiians | 44.1 /100 | #181 | Average $84,729 |
| Uruguayans | 43.5 /100 | #182 | Average $84,691 |
| Spaniards | 42.7 /100 | #183 | Average $84,644 |
| Immigrants | Eastern Africa | 37.4 /100 | #184 | Fair $84,299 |
| Kenyans | 34.2 /100 | #185 | Fair $84,085 |
| Puget Sound Salish | 33.2 /100 | #186 | Fair $84,011 |
| Belgians | 33.2 /100 | #187 | Fair $84,008 |
Demographics Similar to Immigrants from Yemen by Median Household Income
In terms of median household income, the demographic groups most similar to Immigrants from Yemen are Hopi ($65,043, a difference of 0.23%), Pueblo ($64,692, a difference of 0.78%), Kiowa ($65,914, a difference of 1.1%), Crow ($63,681, a difference of 2.4%), and Immigrants from Congo ($66,768, a difference of 2.4%).
| Demographics | Rating | Rank | Median Household Income |
| Natives/Alaskans | 0.0 /100 | #331 | Tragic $67,879 |
| Sioux | 0.0 /100 | #332 | Tragic $67,792 |
| Creek | 0.0 /100 | #333 | Tragic $67,715 |
| Blacks/African Americans | 0.0 /100 | #334 | Tragic $67,573 |
| Cheyenne | 0.0 /100 | #335 | Tragic $66,974 |
| Immigrants | Congo | 0.0 /100 | #336 | Tragic $66,768 |
| Kiowa | 0.0 /100 | #337 | Tragic $65,914 |
| Immigrants | Yemen | 0.0 /100 | #338 | Tragic $65,194 |
| Hopi | 0.0 /100 | #339 | Tragic $65,043 |
| Pueblo | 0.0 /100 | #340 | Tragic $64,692 |
| Crow | 0.0 /100 | #341 | Tragic $63,681 |
| Pima | 0.0 /100 | #342 | Tragic $63,262 |
| Houma | 0.0 /100 | #343 | Tragic $62,575 |
| Tohono O'odham | 0.0 /100 | #344 | Tragic $61,663 |
| Puerto Ricans | 0.0 /100 | #345 | Tragic $59,197 |