Mexican vs White/Caucasian Median Household Income
COMPARE
Mexican
White/Caucasian
Median Household Income
Median Household Income Comparison
Mexicans
Whites/Caucasians
$74,399
MEDIAN HOUSEHOLD INCOME
0.1/ 100
METRIC RATING
285th/ 347
METRIC RANK
$82,029
MEDIAN HOUSEHOLD INCOME
12.2/ 100
METRIC RATING
218th/ 347
METRIC RANK
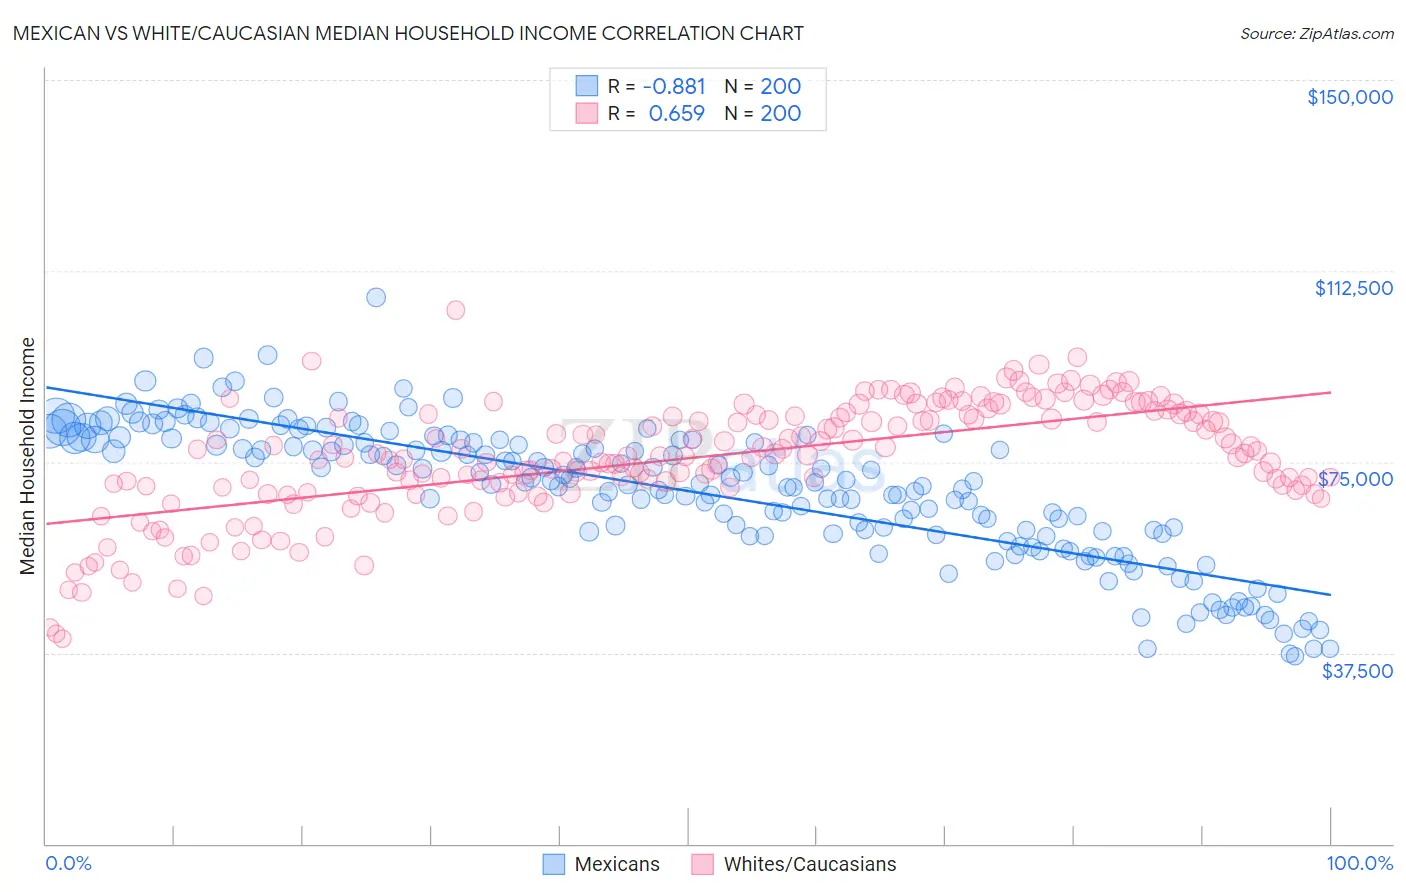
Mexican vs White/Caucasian Median Household Income Correlation Chart
The statistical analysis conducted on geographies consisting of 564,134,448 people shows a very strong negative correlation between the proportion of Mexicans and median household income in the United States with a correlation coefficient (R) of -0.881 and weighted average of $74,399. Similarly, the statistical analysis conducted on geographies consisting of 583,274,044 people shows a significant positive correlation between the proportion of Whites/Caucasians and median household income in the United States with a correlation coefficient (R) of 0.659 and weighted average of $82,029, a difference of 10.3%.
Median Household Income Correlation Summary
| Measurement | Mexican | White/Caucasian |
| Minimum | $36,747 | $40,196 |
| Maximum | $107,254 | $104,886 |
| Range | $70,506 | $64,690 |
| Mean | $69,252 | $75,721 |
| Median | $71,107 | $76,251 |
| Interquartile 25% (IQ1) | $60,819 | $70,055 |
| Interquartile 75% (IQ3) | $79,357 | $84,369 |
| Interquartile Range (IQR) | $18,537 | $14,314 |
| Standard Deviation (Sample) | $13,393 | $11,326 |
| Standard Deviation (Population) | $13,359 | $11,297 |
Similar Demographics by Median Household Income
Demographics Similar to Mexicans by Median Household Income
In terms of median household income, the demographic groups most similar to Mexicans are Immigrants from Somalia ($74,300, a difference of 0.13%), Iroquois ($74,279, a difference of 0.16%), Immigrants from Central America ($74,217, a difference of 0.24%), Yaqui ($74,596, a difference of 0.26%), and Fijian ($74,205, a difference of 0.26%).
| Demographics | Rating | Rank | Median Household Income |
| Osage | 0.2 /100 | #278 | Tragic $75,240 |
| Immigrants | Guatemala | 0.2 /100 | #279 | Tragic $75,123 |
| Senegalese | 0.2 /100 | #280 | Tragic $74,999 |
| Immigrants | Liberia | 0.1 /100 | #281 | Tragic $74,896 |
| Central American Indians | 0.1 /100 | #282 | Tragic $74,847 |
| Cree | 0.1 /100 | #283 | Tragic $74,685 |
| Yaqui | 0.1 /100 | #284 | Tragic $74,596 |
| Mexicans | 0.1 /100 | #285 | Tragic $74,399 |
| Immigrants | Somalia | 0.1 /100 | #286 | Tragic $74,300 |
| Iroquois | 0.1 /100 | #287 | Tragic $74,279 |
| Immigrants | Central America | 0.1 /100 | #288 | Tragic $74,217 |
| Fijians | 0.1 /100 | #289 | Tragic $74,205 |
| Bangladeshis | 0.1 /100 | #290 | Tragic $74,112 |
| Hispanics or Latinos | 0.1 /100 | #291 | Tragic $73,823 |
| Comanche | 0.1 /100 | #292 | Tragic $73,747 |
Demographics Similar to Whites/Caucasians by Median Household Income
In terms of median household income, the demographic groups most similar to Whites/Caucasians are Ecuadorian ($82,070, a difference of 0.050%), Yugoslavian ($82,186, a difference of 0.19%), Vietnamese ($82,248, a difference of 0.27%), Panamanian ($82,272, a difference of 0.30%), and Nigerian ($81,725, a difference of 0.37%).
| Demographics | Rating | Rank | Median Household Income |
| Salvadorans | 15.4 /100 | #211 | Poor $82,449 |
| Venezuelans | 15.3 /100 | #212 | Poor $82,432 |
| Nepalese | 15.1 /100 | #213 | Poor $82,410 |
| Panamanians | 14.0 /100 | #214 | Poor $82,272 |
| Vietnamese | 13.8 /100 | #215 | Poor $82,248 |
| Yugoslavians | 13.3 /100 | #216 | Poor $82,186 |
| Ecuadorians | 12.5 /100 | #217 | Poor $82,070 |
| Whites/Caucasians | 12.2 /100 | #218 | Poor $82,029 |
| Nigerians | 10.3 /100 | #219 | Poor $81,725 |
| Immigrants | Venezuela | 9.0 /100 | #220 | Tragic $81,506 |
| Immigrants | Ghana | 9.0 /100 | #221 | Tragic $81,489 |
| Immigrants | Nigeria | 7.7 /100 | #222 | Tragic $81,236 |
| Immigrants | El Salvador | 7.6 /100 | #223 | Tragic $81,213 |
| Malaysians | 7.0 /100 | #224 | Tragic $81,064 |
| Scotch-Irish | 6.6 /100 | #225 | Tragic $80,972 |