Immigrants from Portugal vs German Russian Median Household Income
COMPARE
Immigrants from Portugal
German Russian
Median Household Income
Median Household Income Comparison
Immigrants from Portugal
German Russians
$84,740
MEDIAN HOUSEHOLD INCOME
44.2/ 100
METRIC RATING
180th/ 347
METRIC RANK
$75,856
MEDIAN HOUSEHOLD INCOME
0.3/ 100
METRIC RATING
267th/ 347
METRIC RANK
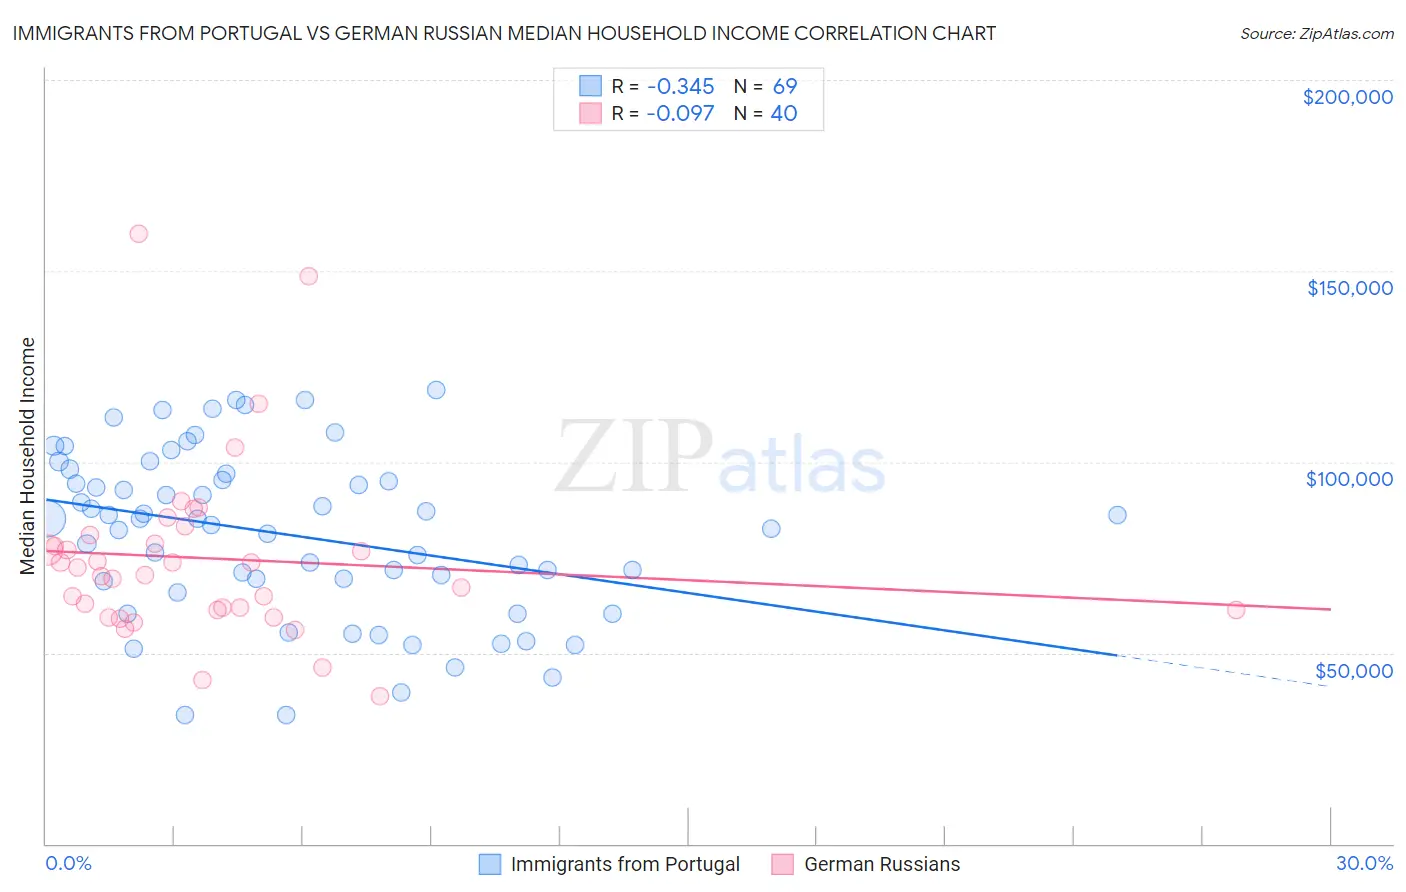
Immigrants from Portugal vs German Russian Median Household Income Correlation Chart
The statistical analysis conducted on geographies consisting of 174,758,543 people shows a mild negative correlation between the proportion of Immigrants from Portugal and median household income in the United States with a correlation coefficient (R) of -0.345 and weighted average of $84,740. Similarly, the statistical analysis conducted on geographies consisting of 96,440,966 people shows a slight negative correlation between the proportion of German Russians and median household income in the United States with a correlation coefficient (R) of -0.097 and weighted average of $75,856, a difference of 11.7%.
Median Household Income Correlation Summary
| Measurement | Immigrants from Portugal | German Russian |
| Minimum | $33,750 | $38,750 |
| Maximum | $118,667 | $159,827 |
| Range | $84,917 | $121,077 |
| Mean | $80,926 | $74,697 |
| Median | $85,116 | $71,396 |
| Interquartile 25% (IQ1) | $67,289 | $61,250 |
| Interquartile 75% (IQ3) | $96,142 | $79,678 |
| Interquartile Range (IQR) | $28,853 | $18,428 |
| Standard Deviation (Sample) | $21,750 | $23,757 |
| Standard Deviation (Population) | $21,592 | $23,458 |
Similar Demographics by Median Household Income
Demographics Similar to Immigrants from Portugal by Median Household Income
In terms of median household income, the demographic groups most similar to Immigrants from Portugal are Hawaiian ($84,729, a difference of 0.010%), Uruguayan ($84,691, a difference of 0.060%), Spaniard ($84,644, a difference of 0.11%), English ($84,915, a difference of 0.21%), and Czechoslovakian ($84,965, a difference of 0.27%).
| Demographics | Rating | Rank | Median Household Income |
| Immigrants | Cameroon | 53.4 /100 | #173 | Average $85,314 |
| Scottish | 50.0 /100 | #174 | Average $85,101 |
| Immigrants | Costa Rica | 49.2 /100 | #175 | Average $85,054 |
| Alsatians | 49.2 /100 | #176 | Average $85,053 |
| Immigrants | Eritrea | 48.8 /100 | #177 | Average $85,025 |
| Czechoslovakians | 47.8 /100 | #178 | Average $84,965 |
| English | 47.0 /100 | #179 | Average $84,915 |
| Immigrants | Portugal | 44.2 /100 | #180 | Average $84,740 |
| Hawaiians | 44.1 /100 | #181 | Average $84,729 |
| Uruguayans | 43.5 /100 | #182 | Average $84,691 |
| Spaniards | 42.7 /100 | #183 | Average $84,644 |
| Immigrants | Eastern Africa | 37.4 /100 | #184 | Fair $84,299 |
| Kenyans | 34.2 /100 | #185 | Fair $84,085 |
| Puget Sound Salish | 33.2 /100 | #186 | Fair $84,011 |
| Belgians | 33.2 /100 | #187 | Fair $84,008 |
Demographics Similar to German Russians by Median Household Income
In terms of median household income, the demographic groups most similar to German Russians are Immigrants from Jamaica ($75,851, a difference of 0.010%), Cape Verdean ($75,848, a difference of 0.010%), Hmong ($75,839, a difference of 0.020%), Pennsylvania German ($75,814, a difference of 0.060%), and American ($75,932, a difference of 0.10%).
| Demographics | Rating | Rank | Median Household Income |
| Jamaicans | 0.4 /100 | #260 | Tragic $76,583 |
| Immigrants | Grenada | 0.4 /100 | #261 | Tragic $76,517 |
| French American Indians | 0.4 /100 | #262 | Tragic $76,387 |
| Alaskan Athabascans | 0.4 /100 | #263 | Tragic $76,383 |
| Guatemalans | 0.3 /100 | #264 | Tragic $75,961 |
| Immigrants | Belize | 0.3 /100 | #265 | Tragic $75,938 |
| Americans | 0.3 /100 | #266 | Tragic $75,932 |
| German Russians | 0.3 /100 | #267 | Tragic $75,856 |
| Immigrants | Jamaica | 0.3 /100 | #268 | Tragic $75,851 |
| Cape Verdeans | 0.3 /100 | #269 | Tragic $75,848 |
| Hmong | 0.3 /100 | #270 | Tragic $75,839 |
| Pennsylvania Germans | 0.3 /100 | #271 | Tragic $75,814 |
| Somalis | 0.3 /100 | #272 | Tragic $75,782 |
| Liberians | 0.2 /100 | #273 | Tragic $75,667 |
| British West Indians | 0.2 /100 | #274 | Tragic $75,647 |