Immigrants from Western Africa vs White/Caucasian Median Household Income
COMPARE
Immigrants from Western Africa
White/Caucasian
Median Household Income
Median Household Income Comparison
Immigrants from Western Africa
Whites/Caucasians
$79,490
MEDIAN HOUSEHOLD INCOME
2.7/ 100
METRIC RATING
240th/ 347
METRIC RANK
$82,029
MEDIAN HOUSEHOLD INCOME
12.2/ 100
METRIC RATING
218th/ 347
METRIC RANK
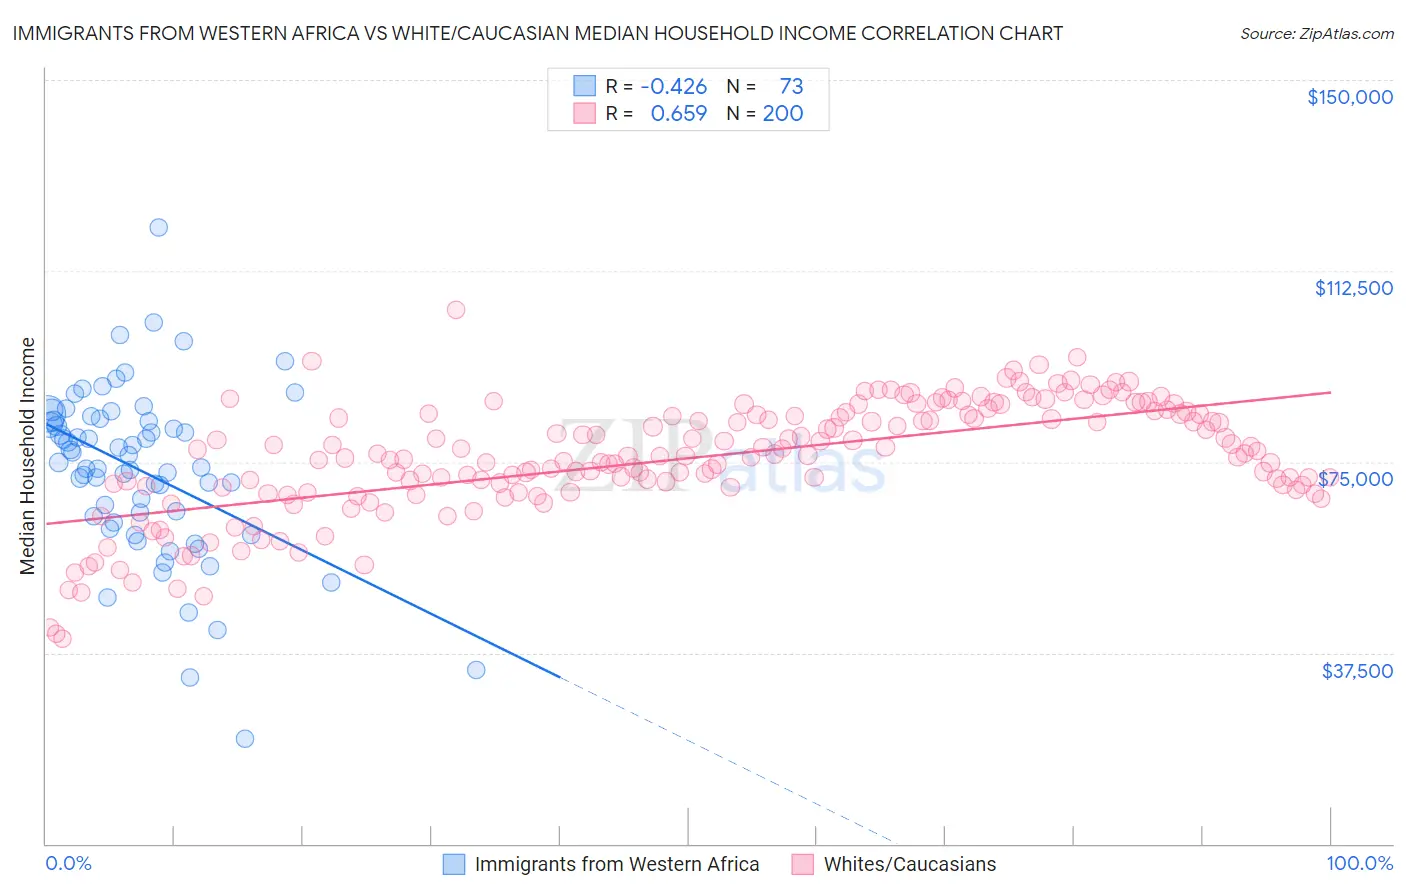
Immigrants from Western Africa vs White/Caucasian Median Household Income Correlation Chart
The statistical analysis conducted on geographies consisting of 357,459,311 people shows a moderate negative correlation between the proportion of Immigrants from Western Africa and median household income in the United States with a correlation coefficient (R) of -0.426 and weighted average of $79,490. Similarly, the statistical analysis conducted on geographies consisting of 583,274,044 people shows a significant positive correlation between the proportion of Whites/Caucasians and median household income in the United States with a correlation coefficient (R) of 0.659 and weighted average of $82,029, a difference of 3.2%.
Median Household Income Correlation Summary
| Measurement | Immigrants from Western Africa | White/Caucasian |
| Minimum | $20,699 | $40,196 |
| Maximum | $120,953 | $104,886 |
| Range | $100,254 | $64,690 |
| Mean | $73,270 | $75,721 |
| Median | $74,855 | $76,251 |
| Interquartile 25% (IQ1) | $63,706 | $70,055 |
| Interquartile 75% (IQ3) | $83,237 | $84,369 |
| Interquartile Range (IQR) | $19,531 | $14,314 |
| Standard Deviation (Sample) | $16,693 | $11,326 |
| Standard Deviation (Population) | $16,579 | $11,297 |
Similar Demographics by Median Household Income
Demographics Similar to Immigrants from Western Africa by Median Household Income
In terms of median household income, the demographic groups most similar to Immigrants from Western Africa are Alaska Native ($79,509, a difference of 0.020%), Nonimmigrants ($79,429, a difference of 0.080%), Barbadian ($79,664, a difference of 0.22%), Nicaraguan ($79,737, a difference of 0.31%), and Immigrants from Sudan ($79,103, a difference of 0.49%).
| Demographics | Rating | Rank | Median Household Income |
| Immigrants | Azores | 4.5 /100 | #233 | Tragic $80,357 |
| Immigrants | Ecuador | 4.5 /100 | #234 | Tragic $80,341 |
| Immigrants | Guyana | 4.5 /100 | #235 | Tragic $80,324 |
| Immigrants | Bosnia and Herzegovina | 3.4 /100 | #236 | Tragic $79,888 |
| Nicaraguans | 3.1 /100 | #237 | Tragic $79,737 |
| Barbadians | 3.0 /100 | #238 | Tragic $79,664 |
| Alaska Natives | 2.7 /100 | #239 | Tragic $79,509 |
| Immigrants | Western Africa | 2.7 /100 | #240 | Tragic $79,490 |
| Immigrants | Nonimmigrants | 2.6 /100 | #241 | Tragic $79,429 |
| Immigrants | Sudan | 2.1 /100 | #242 | Tragic $79,103 |
| Immigrants | Barbados | 1.9 /100 | #243 | Tragic $78,989 |
| Marshallese | 1.9 /100 | #244 | Tragic $78,930 |
| Inupiat | 1.8 /100 | #245 | Tragic $78,841 |
| Central Americans | 1.7 /100 | #246 | Tragic $78,803 |
| Immigrants | Burma/Myanmar | 1.6 /100 | #247 | Tragic $78,682 |
Demographics Similar to Whites/Caucasians by Median Household Income
In terms of median household income, the demographic groups most similar to Whites/Caucasians are Ecuadorian ($82,070, a difference of 0.050%), Yugoslavian ($82,186, a difference of 0.19%), Vietnamese ($82,248, a difference of 0.27%), Panamanian ($82,272, a difference of 0.30%), and Nigerian ($81,725, a difference of 0.37%).
| Demographics | Rating | Rank | Median Household Income |
| Salvadorans | 15.4 /100 | #211 | Poor $82,449 |
| Venezuelans | 15.3 /100 | #212 | Poor $82,432 |
| Nepalese | 15.1 /100 | #213 | Poor $82,410 |
| Panamanians | 14.0 /100 | #214 | Poor $82,272 |
| Vietnamese | 13.8 /100 | #215 | Poor $82,248 |
| Yugoslavians | 13.3 /100 | #216 | Poor $82,186 |
| Ecuadorians | 12.5 /100 | #217 | Poor $82,070 |
| Whites/Caucasians | 12.2 /100 | #218 | Poor $82,029 |
| Nigerians | 10.3 /100 | #219 | Poor $81,725 |
| Immigrants | Venezuela | 9.0 /100 | #220 | Tragic $81,506 |
| Immigrants | Ghana | 9.0 /100 | #221 | Tragic $81,489 |
| Immigrants | Nigeria | 7.7 /100 | #222 | Tragic $81,236 |
| Immigrants | El Salvador | 7.6 /100 | #223 | Tragic $81,213 |
| Malaysians | 7.0 /100 | #224 | Tragic $81,064 |
| Scotch-Irish | 6.6 /100 | #225 | Tragic $80,972 |