Immigrants from Portugal vs White/Caucasian Bachelor's Degree
COMPARE
Immigrants from Portugal
White/Caucasian
Bachelor's Degree
Bachelor's Degree Comparison
Immigrants from Portugal
Whites/Caucasians
32.2%
BACHELOR'S DEGREE
0.2/ 100
METRIC RATING
268th/ 347
METRIC RANK
35.3%
BACHELOR'S DEGREE
5.9/ 100
METRIC RATING
229th/ 347
METRIC RANK
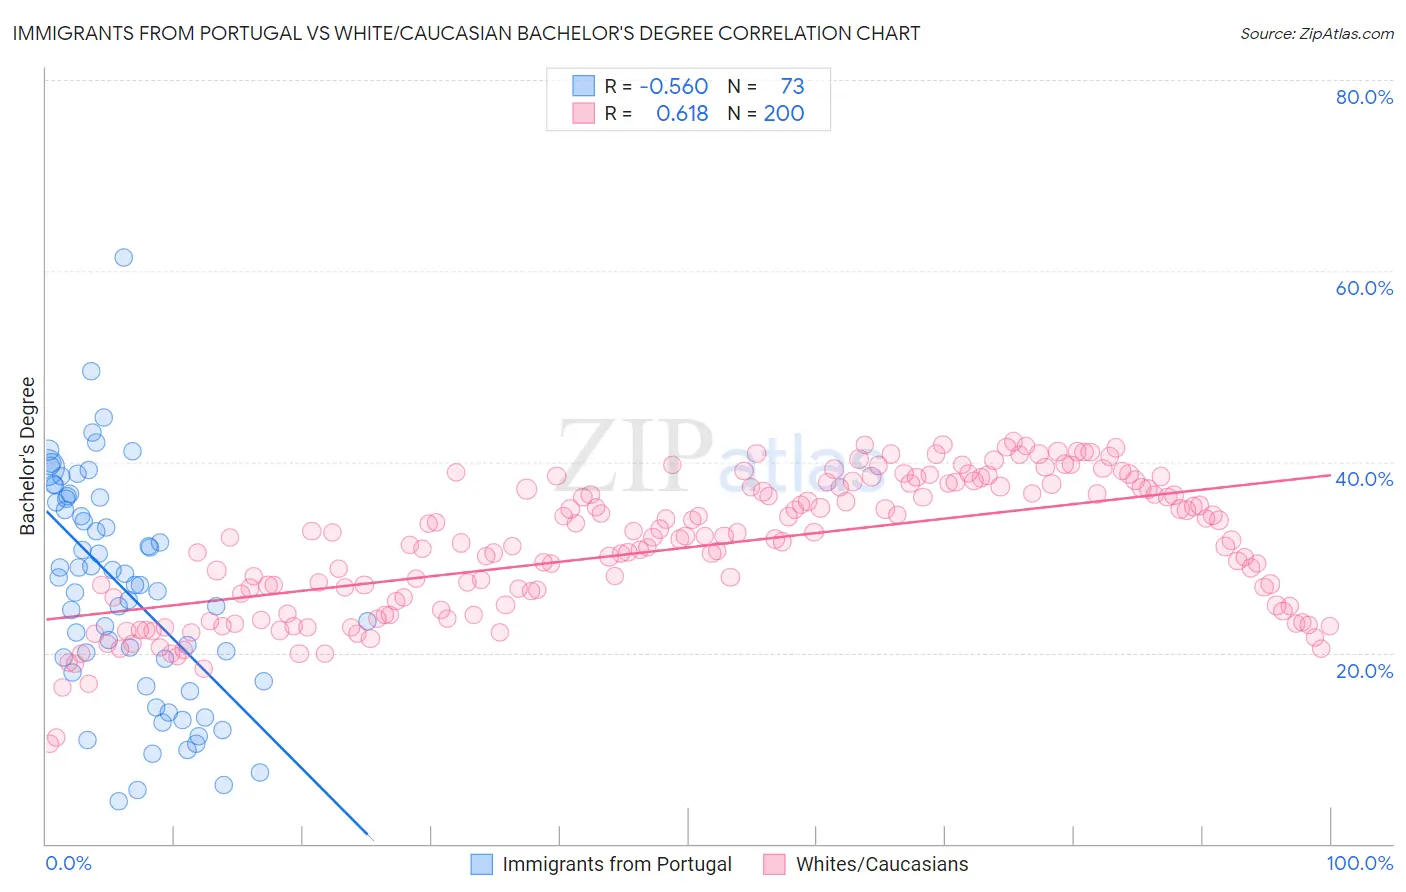
Immigrants from Portugal vs White/Caucasian Bachelor's Degree Correlation Chart
The statistical analysis conducted on geographies consisting of 174,788,694 people shows a substantial negative correlation between the proportion of Immigrants from Portugal and percentage of population with at least bachelor's degree education in the United States with a correlation coefficient (R) of -0.560 and weighted average of 32.2%. Similarly, the statistical analysis conducted on geographies consisting of 584,716,229 people shows a significant positive correlation between the proportion of Whites/Caucasians and percentage of population with at least bachelor's degree education in the United States with a correlation coefficient (R) of 0.618 and weighted average of 35.3%, a difference of 9.4%.
Bachelor's Degree Correlation Summary
| Measurement | Immigrants from Portugal | White/Caucasian |
| Minimum | 4.4% | 10.4% |
| Maximum | 61.4% | 42.1% |
| Range | 57.0% | 31.7% |
| Mean | 26.7% | 31.0% |
| Median | 27.2% | 31.9% |
| Interquartile 25% (IQ1) | 17.5% | 24.9% |
| Interquartile 75% (IQ3) | 36.2% | 37.3% |
| Interquartile Range (IQR) | 18.7% | 12.4% |
| Standard Deviation (Sample) | 11.7% | 7.1% |
| Standard Deviation (Population) | 11.6% | 7.1% |
Similar Demographics by Bachelor's Degree
Demographics Similar to Immigrants from Portugal by Bachelor's Degree
In terms of bachelor's degree, the demographic groups most similar to Immigrants from Portugal are Immigrants from Belize (32.1%, a difference of 0.41%), Cuban (32.5%, a difference of 0.76%), Immigrants from Dominica (32.5%, a difference of 0.88%), Bahamian (32.5%, a difference of 0.91%), and Central American Indian (32.5%, a difference of 0.94%).
| Demographics | Rating | Rank | Bachelor's Degree |
| Africans | 0.5 /100 | #261 | Tragic 32.9% |
| Immigrants | Jamaica | 0.5 /100 | #262 | Tragic 32.9% |
| Belizeans | 0.4 /100 | #263 | Tragic 32.8% |
| Central American Indians | 0.3 /100 | #264 | Tragic 32.5% |
| Bahamians | 0.3 /100 | #265 | Tragic 32.5% |
| Immigrants | Dominica | 0.3 /100 | #266 | Tragic 32.5% |
| Cubans | 0.3 /100 | #267 | Tragic 32.5% |
| Immigrants | Portugal | 0.2 /100 | #268 | Tragic 32.2% |
| Immigrants | Belize | 0.2 /100 | #269 | Tragic 32.1% |
| Immigrants | Nicaragua | 0.2 /100 | #270 | Tragic 31.9% |
| Central Americans | 0.2 /100 | #271 | Tragic 31.9% |
| Comanche | 0.2 /100 | #272 | Tragic 31.9% |
| Americans | 0.2 /100 | #273 | Tragic 31.9% |
| Potawatomi | 0.2 /100 | #274 | Tragic 31.9% |
| Samoans | 0.1 /100 | #275 | Tragic 31.8% |
Demographics Similar to Whites/Caucasians by Bachelor's Degree
In terms of bachelor's degree, the demographic groups most similar to Whites/Caucasians are Immigrants from Trinidad and Tobago (35.3%, a difference of 0.080%), Ecuadorian (35.4%, a difference of 0.31%), Portuguese (35.5%, a difference of 0.57%), Immigrants from Burma/Myanmar (35.5%, a difference of 0.61%), and Immigrants from Barbados (35.5%, a difference of 0.68%).
| Demographics | Rating | Rank | Bachelor's Degree |
| Trinidadians and Tobagonians | 8.8 /100 | #222 | Tragic 35.7% |
| French Canadians | 8.3 /100 | #223 | Tragic 35.6% |
| Immigrants | Barbados | 7.5 /100 | #224 | Tragic 35.5% |
| Immigrants | Burma/Myanmar | 7.3 /100 | #225 | Tragic 35.5% |
| Portuguese | 7.2 /100 | #226 | Tragic 35.5% |
| Ecuadorians | 6.6 /100 | #227 | Tragic 35.4% |
| Immigrants | Trinidad and Tobago | 6.0 /100 | #228 | Tragic 35.3% |
| Whites/Caucasians | 5.9 /100 | #229 | Tragic 35.3% |
| Immigrants | Grenada | 4.3 /100 | #230 | Tragic 35.0% |
| Immigrants | St. Vincent and the Grenadines | 4.3 /100 | #231 | Tragic 35.0% |
| Hmong | 3.4 /100 | #232 | Tragic 34.8% |
| Immigrants | Ecuador | 3.3 /100 | #233 | Tragic 34.7% |
| Guamanians/Chamorros | 3.0 /100 | #234 | Tragic 34.6% |
| Immigrants | West Indies | 2.9 /100 | #235 | Tragic 34.6% |
| Liberians | 2.8 /100 | #236 | Tragic 34.6% |