Immigrants from Portugal vs White/Caucasian Cognitive Disability
COMPARE
Immigrants from Portugal
White/Caucasian
Cognitive Disability
Cognitive Disability Comparison
Immigrants from Portugal
Whites/Caucasians
17.2%
COGNITIVE DISABILITY
61.8/ 100
METRIC RATING
169th/ 347
METRIC RANK
17.0%
COGNITIVE DISABILITY
92.1/ 100
METRIC RATING
132nd/ 347
METRIC RANK
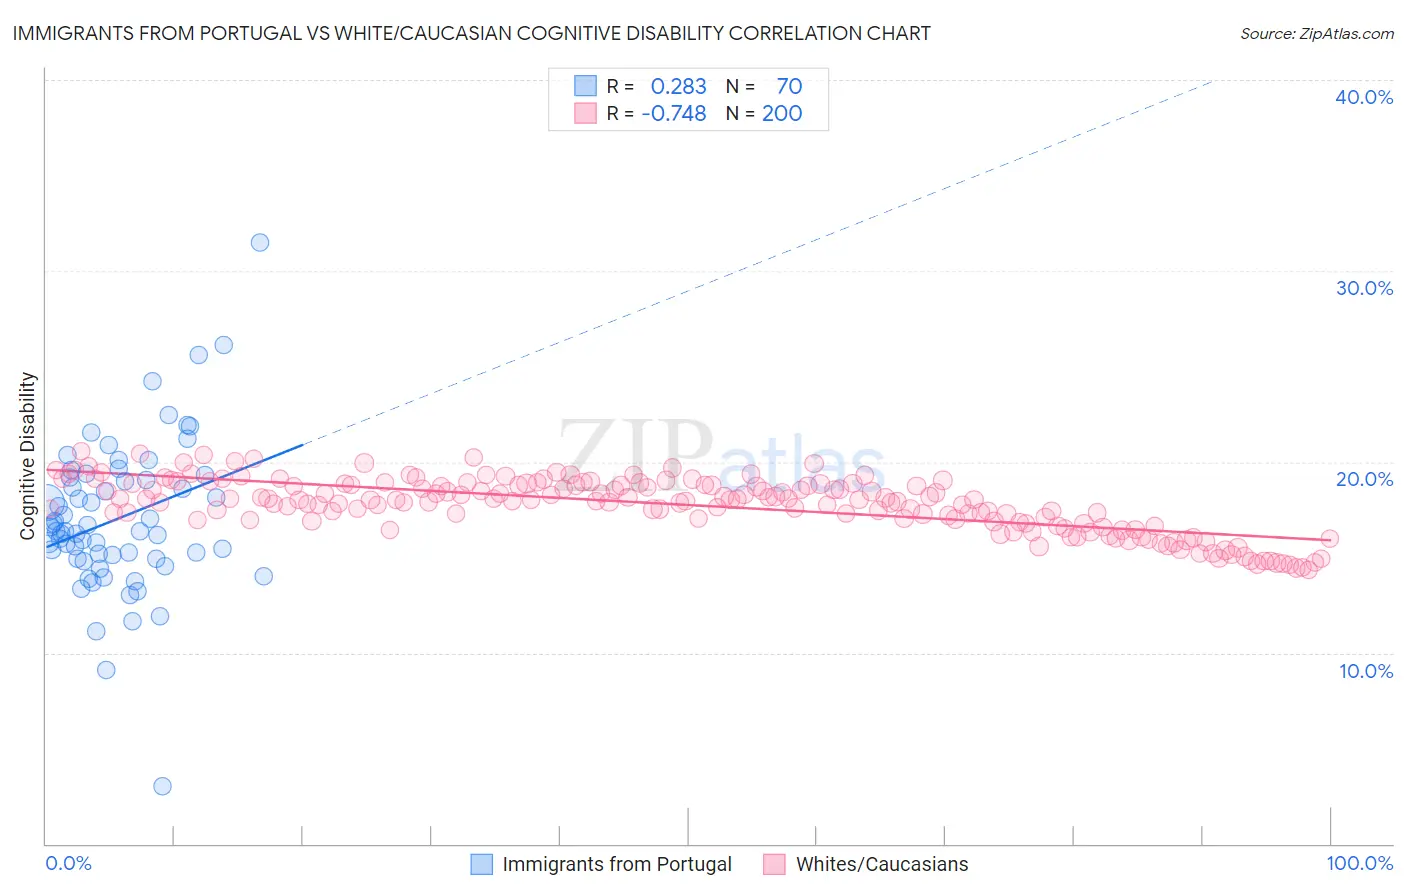
Immigrants from Portugal vs White/Caucasian Cognitive Disability Correlation Chart
The statistical analysis conducted on geographies consisting of 174,785,813 people shows a weak positive correlation between the proportion of Immigrants from Portugal and percentage of population with cognitive disability in the United States with a correlation coefficient (R) of 0.283 and weighted average of 17.2%. Similarly, the statistical analysis conducted on geographies consisting of 584,856,433 people shows a strong negative correlation between the proportion of Whites/Caucasians and percentage of population with cognitive disability in the United States with a correlation coefficient (R) of -0.748 and weighted average of 17.0%, a difference of 1.4%.
Cognitive Disability Correlation Summary
| Measurement | Immigrants from Portugal | White/Caucasian |
| Minimum | 3.0% | 14.3% |
| Maximum | 31.5% | 20.5% |
| Range | 28.5% | 6.2% |
| Mean | 17.0% | 17.7% |
| Median | 16.4% | 18.0% |
| Interquartile 25% (IQ1) | 15.0% | 16.9% |
| Interquartile 75% (IQ3) | 19.2% | 18.8% |
| Interquartile Range (IQR) | 4.3% | 1.9% |
| Standard Deviation (Sample) | 4.0% | 1.4% |
| Standard Deviation (Population) | 4.0% | 1.4% |
Similar Demographics by Cognitive Disability
Demographics Similar to Immigrants from Portugal by Cognitive Disability
In terms of cognitive disability, the demographic groups most similar to Immigrants from Portugal are Immigrants (17.2%, a difference of 0.020%), Immigrants from Syria (17.2%, a difference of 0.050%), Ecuadorian (17.2%, a difference of 0.070%), Tlingit-Haida (17.2%, a difference of 0.070%), and Immigrants from Ecuador (17.2%, a difference of 0.080%).
| Demographics | Rating | Rank | Cognitive Disability |
| Yugoslavians | 71.6 /100 | #162 | Good 17.2% |
| Immigrants | Switzerland | 71.5 /100 | #163 | Good 17.2% |
| Armenians | 70.1 /100 | #164 | Good 17.2% |
| Immigrants | Albania | 64.9 /100 | #165 | Good 17.2% |
| Immigrants | Ecuador | 64.4 /100 | #166 | Good 17.2% |
| Immigrants | Syria | 63.5 /100 | #167 | Good 17.2% |
| Immigrants | Immigrants | 62.5 /100 | #168 | Good 17.2% |
| Immigrants | Portugal | 61.8 /100 | #169 | Good 17.2% |
| Ecuadorians | 59.6 /100 | #170 | Average 17.2% |
| Tlingit-Haida | 59.4 /100 | #171 | Average 17.2% |
| Immigrants | Turkey | 56.7 /100 | #172 | Average 17.2% |
| Immigrants | Northern Africa | 50.2 /100 | #173 | Average 17.3% |
| Laotians | 50.0 /100 | #174 | Average 17.3% |
| Tsimshian | 49.8 /100 | #175 | Average 17.3% |
| Shoshone | 49.2 /100 | #176 | Average 17.3% |
Demographics Similar to Whites/Caucasians by Cognitive Disability
In terms of cognitive disability, the demographic groups most similar to Whites/Caucasians are Immigrants from Germany (17.0%, a difference of 0.0%), Immigrants from Vietnam (17.0%, a difference of 0.020%), Immigrants from Jordan (17.0%, a difference of 0.030%), Immigrants from Chile (17.0%, a difference of 0.040%), and Immigrants from Uruguay (17.0%, a difference of 0.080%).
| Demographics | Rating | Rank | Cognitive Disability |
| Scandinavians | 94.1 /100 | #125 | Exceptional 16.9% |
| Europeans | 93.4 /100 | #126 | Exceptional 17.0% |
| Immigrants | Costa Rica | 93.1 /100 | #127 | Exceptional 17.0% |
| Nicaraguans | 93.0 /100 | #128 | Exceptional 17.0% |
| Immigrants | Uruguay | 92.9 /100 | #129 | Exceptional 17.0% |
| Immigrants | Vietnam | 92.4 /100 | #130 | Exceptional 17.0% |
| Immigrants | Germany | 92.1 /100 | #131 | Exceptional 17.0% |
| Whites/Caucasians | 92.1 /100 | #132 | Exceptional 17.0% |
| Immigrants | Jordan | 91.9 /100 | #133 | Exceptional 17.0% |
| Immigrants | Chile | 91.7 /100 | #134 | Exceptional 17.0% |
| Lebanese | 91.3 /100 | #135 | Exceptional 17.0% |
| Israelis | 91.0 /100 | #136 | Exceptional 17.0% |
| Immigrants | Norway | 90.9 /100 | #137 | Exceptional 17.0% |
| Welsh | 90.8 /100 | #138 | Exceptional 17.0% |
| French | 90.0 /100 | #139 | Excellent 17.0% |