Immigrants from Peru vs Canadian Median Earnings
COMPARE
Immigrants from Peru
Canadian
Median Earnings
Median Earnings Comparison
Immigrants from Peru
Canadians
$47,025
MEDIAN EARNINGS
69.6/ 100
METRIC RATING
159th/ 347
METRIC RANK
$47,911
MEDIAN EARNINGS
88.8/ 100
METRIC RATING
139th/ 347
METRIC RANK
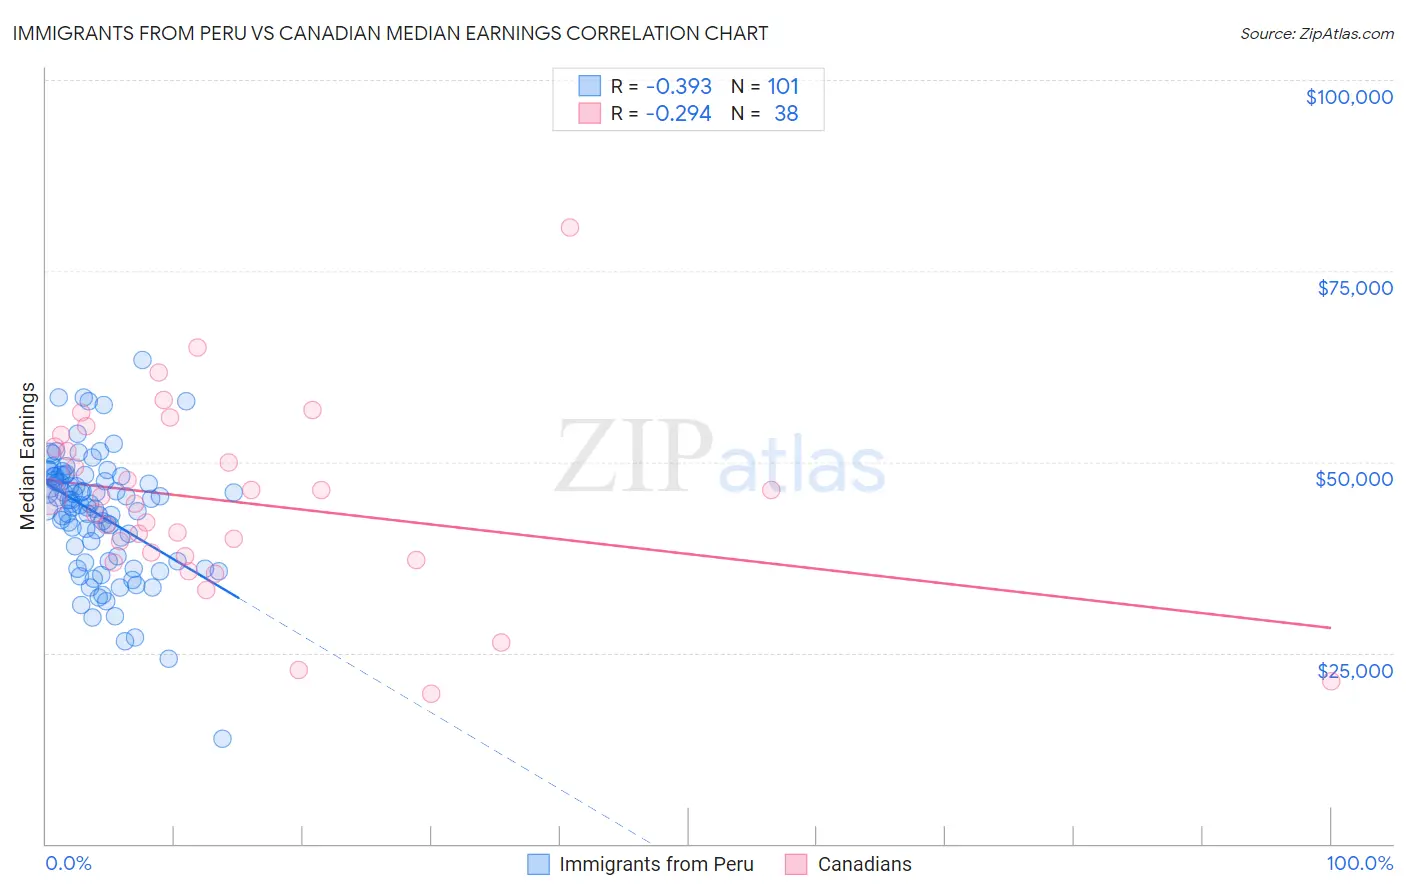
Immigrants from Peru vs Canadian Median Earnings Correlation Chart
The statistical analysis conducted on geographies consisting of 328,851,248 people shows a mild negative correlation between the proportion of Immigrants from Peru and median earnings in the United States with a correlation coefficient (R) of -0.393 and weighted average of $47,025. Similarly, the statistical analysis conducted on geographies consisting of 437,494,547 people shows a weak negative correlation between the proportion of Canadians and median earnings in the United States with a correlation coefficient (R) of -0.294 and weighted average of $47,911, a difference of 1.9%.
Median Earnings Correlation Summary
| Measurement | Immigrants from Peru | Canadian |
| Minimum | $13,750 | $19,688 |
| Maximum | $63,387 | $80,682 |
| Range | $49,637 | $60,994 |
| Mean | $43,144 | $44,712 |
| Median | $44,577 | $44,948 |
| Interquartile 25% (IQ1) | $36,980 | $37,642 |
| Interquartile 75% (IQ3) | $48,145 | $51,935 |
| Interquartile Range (IQR) | $11,165 | $14,293 |
| Standard Deviation (Sample) | $8,031 | $12,220 |
| Standard Deviation (Population) | $7,991 | $12,058 |
Demographics Similar to Immigrants from Peru and Canadians by Median Earnings
In terms of median earnings, the demographic groups most similar to Immigrants from Peru are Slovak ($47,095, a difference of 0.15%), Czech ($47,221, a difference of 0.42%), Irish ($47,276, a difference of 0.53%), Immigrants from Vietnam ($47,282, a difference of 0.55%), and Immigrants from Portugal ($47,304, a difference of 0.59%). Similarly, the demographic groups most similar to Canadians are Taiwanese ($47,902, a difference of 0.020%), Immigrants from Sierra Leone ($47,875, a difference of 0.080%), Ugandan ($47,854, a difference of 0.12%), Swedish ($47,851, a difference of 0.13%), and Hungarian ($47,795, a difference of 0.24%).
| Demographics | Rating | Rank | Median Earnings |
| Canadians | 88.8 /100 | #139 | Excellent $47,911 |
| Taiwanese | 88.7 /100 | #140 | Excellent $47,902 |
| Immigrants | Sierra Leone | 88.3 /100 | #141 | Excellent $47,875 |
| Ugandans | 88.0 /100 | #142 | Excellent $47,854 |
| Swedes | 88.0 /100 | #143 | Excellent $47,851 |
| Hungarians | 87.1 /100 | #144 | Excellent $47,795 |
| Immigrants | Saudi Arabia | 85.6 /100 | #145 | Excellent $47,704 |
| Immigrants | Chile | 85.5 /100 | #146 | Excellent $47,697 |
| Immigrants | South Eastern Asia | 85.0 /100 | #147 | Excellent $47,671 |
| Immigrants | Eritrea | 84.8 /100 | #148 | Excellent $47,657 |
| Luxembourgers | 84.5 /100 | #149 | Excellent $47,640 |
| Peruvians | 84.2 /100 | #150 | Excellent $47,628 |
| Immigrants | Oceania | 84.1 /100 | #151 | Excellent $47,617 |
| Immigrants | Germany | 83.1 /100 | #152 | Excellent $47,566 |
| Slavs | 81.1 /100 | #153 | Excellent $47,470 |
| Immigrants | Portugal | 77.3 /100 | #154 | Good $47,304 |
| Immigrants | Vietnam | 76.7 /100 | #155 | Good $47,282 |
| Irish | 76.6 /100 | #156 | Good $47,276 |
| Czechs | 75.1 /100 | #157 | Good $47,221 |
| Slovaks | 71.7 /100 | #158 | Good $47,095 |
| Immigrants | Peru | 69.6 /100 | #159 | Good $47,025 |