Immigrants from Peru vs Apache 5th Grade

COMPARE

Immigrants from Peru
Race
Ancestry
AfghanAfricanAlaska NativeAlaskan AthabascanAlbanianAleutAlsatianAmericanArabArapahoArgentineanArmenianAssyrian/Chaldean/SyriacAustralianAustrianBahamianBangladeshiBarbadianBasqueBelgianBelizeanBermudanBhutaneseBlackfeetBolivianBrazilianBritishBritish West IndianBulgarianBurmeseCajunCambodianCanadianCape VerdeanCarpatho RusynCelticCentral AmericanCentral American IndianCherokeeCheyenneChickasawChileanChineseChippewaChoctawColombianColvilleComancheCosta RicanCreeCreekCroatianCrowCubanCypriotCzechCzechoslovakianDanishDelawareDominicanDutchDutch West IndianEastern EuropeanEcuadorianEgyptianEnglishEstonianEthiopianEuropeanFijianFilipinoFinnishFrenchFrench American IndianFrench CanadianGermanGerman RussianGhanaianGreekGuamanian/ChamorroGuatemalanGuyaneseHaitianHmongHonduranHopiHoumaHungarianIcelanderIndian (Asian)IndonesianInupiatIranianIraqiIrishIroquoisIsraeliItalianJamaicanJapaneseJordanianKenyanKiowaKoreanLaotianLatvianLebaneseLiberianLithuanianLumbeeLuxembourgerMacedonianMalaysianMalteseMarshalleseMenomineeMexicanMexican American IndianMongolianMoroccanNative HawaiianNavajoNepaleseNew ZealanderNicaraguanNigerianNorthern EuropeanNorwegianOkinawanOsageOttawaPaiutePakistaniPalestinianPanamanianParaguayanPennsylvania GermanPeruvianPimaPolishPortuguesePotawatomiPuebloPuerto RicanPuget Sound SalishRomanianRussianSalvadoranSamoanScandinavianScotch-IrishScottishSeminoleSenegaleseSerbianShoshoneSierra LeoneanSiouxSlavicSlovakSloveneSomaliSouth AfricanSouth AmericanSouth American IndianSoviet UnionSpaniardSpanishSpanish AmericanSpanish American IndianSri LankanSubsaharan AfricanSudaneseSwedishSwissSyrianTaiwaneseThaiTlingit-HaidaTohono O'OdhamTonganTrinidadian and TobagonianTsimshianTurkishU.S. Virgin IslanderUgandanUkrainianUruguayanUteVenezuelanVietnameseWelshWest IndianYakamaYaquiYugoslavianYumanYup'ikZimbabwean
Immigration
NonimmigrantsImmigrantsAfghanistanAfricaAlbaniaArgentinaArmeniaAsiaAustraliaAustriaBahamasBangladeshBarbadosBelarusBelgiumBelizeBoliviaBosnia and HerzegovinaBrazilBulgariaBurma/MyanmarCabo VerdeCambodiaCameroonCanadaCaribbeanCentral AmericaChileChinaColombiaCongoCosta RicaCroatiaCubaCzechoslovakiaDenmarkDominicaDominican RepublicEastern AfricaEastern AsiaEastern EuropeEcuadorEgyptEl SalvadorEnglandEritreaEthiopiaEuropeFijiFranceGermanyGhanaGreeceGrenadaGuatemalaGuyanaHaitiHondurasHong KongHungaryIndiaIndonesiaIranIraqIrelandIsraelItalyJamaicaJapanJordanKazakhstanKenyaKoreaKuwaitLaosLatin AmericaLatviaLebanonLiberiaLithuaniaMalaysiaMexicoMicronesiaMiddle AfricaMoldovaMoroccoNepalNetherlandsNicaraguaNigeriaNorth AmericaNorth MacedoniaNorthern AfricaNorthern EuropeNorwayOceaniaPakistanPanamaPeruPhilippinesPolandPortugalRomaniaRussiaSaudi ArabiaScotlandSenegalSerbiaSierra LeoneSingaporeSomaliaSouth AfricaSouth AmericaSouth Central AsiaSouth Eastern AsiaSouthern EuropeSpainSri LankaSt. Vincent and the GrenadinesSudanSwedenSwitzerlandSyriaTaiwanThailandTrinidad and TobagoTurkeyUgandaUkraineUruguayUzbekistanVenezuelaVietnamWest IndiesWestern AfricaWestern AsiaWestern EuropeYemenZaireZimbabweAzores
Apache
Race
Ancestry
AfghanAfricanAlaska NativeAlaskan AthabascanAlbanianAleutAlsatianAmericanApacheArabArapahoArgentineanArmenianAssyrian/Chaldean/SyriacAustralianAustrianBahamianBangladeshiBarbadianBasqueBelgianBelizeanBermudanBhutaneseBlackfeetBolivianBrazilianBritishBritish West IndianBulgarianBurmeseCajunCambodianCanadianCape VerdeanCarpatho RusynCelticCentral AmericanCentral American IndianCherokeeCheyenneChickasawChileanChineseChippewaChoctawColombianColvilleComancheCosta RicanCreeCreekCroatianCrowCubanCypriotCzechCzechoslovakianDanishDelawareDominicanDutchDutch West IndianEastern EuropeanEcuadorianEgyptianEnglishEstonianEthiopianEuropeanFijianFilipinoFinnishFrenchFrench American IndianFrench CanadianGermanGerman RussianGhanaianGreekGuamanian/ChamorroGuatemalanGuyaneseHaitianHmongHonduranHopiHoumaHungarianIcelanderIndian (Asian)IndonesianInupiatIranianIraqiIrishIroquoisIsraeliItalianJamaicanJapaneseJordanianKenyanKiowaKoreanLaotianLatvianLebaneseLiberianLithuanianLumbeeLuxembourgerMacedonianMalaysianMalteseMarshalleseMenomineeMexicanMexican American IndianMongolianMoroccanNative HawaiianNavajoNepaleseNew ZealanderNicaraguanNigerianNorthern EuropeanNorwegianOkinawanOsageOttawaPaiutePakistaniPalestinianPanamanianParaguayanPennsylvania GermanPeruvianPimaPolishPortuguesePotawatomiPuebloPuerto RicanPuget Sound SalishRomanianRussianSalvadoranSamoanScandinavianScotch-IrishScottishSeminoleSenegaleseSerbianShoshoneSierra LeoneanSiouxSlavicSlovakSloveneSomaliSouth AfricanSouth AmericanSouth American IndianSoviet UnionSpaniardSpanishSpanish AmericanSpanish American IndianSri LankanSubsaharan AfricanSudaneseSwedishSwissSyrianTaiwaneseThaiTlingit-HaidaTohono O'OdhamTonganTrinidadian and TobagonianTsimshianTurkishU.S. Virgin IslanderUgandanUkrainianUruguayanUteVenezuelanVietnameseWelshWest IndianYakamaYaquiYugoslavianYumanYup'ikZimbabwean
Immigration
NonimmigrantsImmigrantsAfghanistanAfricaAlbaniaArgentinaArmeniaAsiaAustraliaAustriaBahamasBangladeshBarbadosBelarusBelgiumBelizeBoliviaBosnia and HerzegovinaBrazilBulgariaBurma/MyanmarCabo VerdeCambodiaCameroonCanadaCaribbeanCentral AmericaChileChinaColombiaCongoCosta RicaCroatiaCubaCzechoslovakiaDenmarkDominicaDominican RepublicEastern AfricaEastern AsiaEastern EuropeEcuadorEgyptEl SalvadorEnglandEritreaEthiopiaEuropeFijiFranceGermanyGhanaGreeceGrenadaGuatemalaGuyanaHaitiHondurasHong KongHungaryIndiaIndonesiaIranIraqIrelandIsraelItalyJamaicaJapanJordanKazakhstanKenyaKoreaKuwaitLaosLatin AmericaLatviaLebanonLiberiaLithuaniaMalaysiaMexicoMicronesiaMiddle AfricaMoldovaMoroccoNepalNetherlandsNicaraguaNigeriaNorth AmericaNorth MacedoniaNorthern AfricaNorthern EuropeNorwayOceaniaPakistanPanamaPhilippinesPolandPortugalRomaniaRussiaSaudi ArabiaScotlandSenegalSerbiaSierra LeoneSingaporeSomaliaSouth AfricaSouth AmericaSouth Central AsiaSouth Eastern AsiaSouthern EuropeSpainSri LankaSt. Vincent and the GrenadinesSudanSwedenSwitzerlandSyriaTaiwanThailandTrinidad and TobagoTurkeyUgandaUkraineUruguayUzbekistanVenezuelaVietnamWest IndiesWestern AfricaWestern AsiaWestern EuropeYemenZaireZimbabweAzores
5th Grade
Income
Poverty
Unemployment
Labor Participation
Family Structure
Vehicle Availability
Education Level
Disability

5th Grade Comparison

Immigrants from Peru

Apache

Tragic
Average
96.6%
5TH GRADE
0.1/ 100
METRIC RATING
275th/ 347
METRIC RANK
97.4%
5TH GRADE
57.2/ 100
METRIC RATING
166th/ 347
METRIC RANK

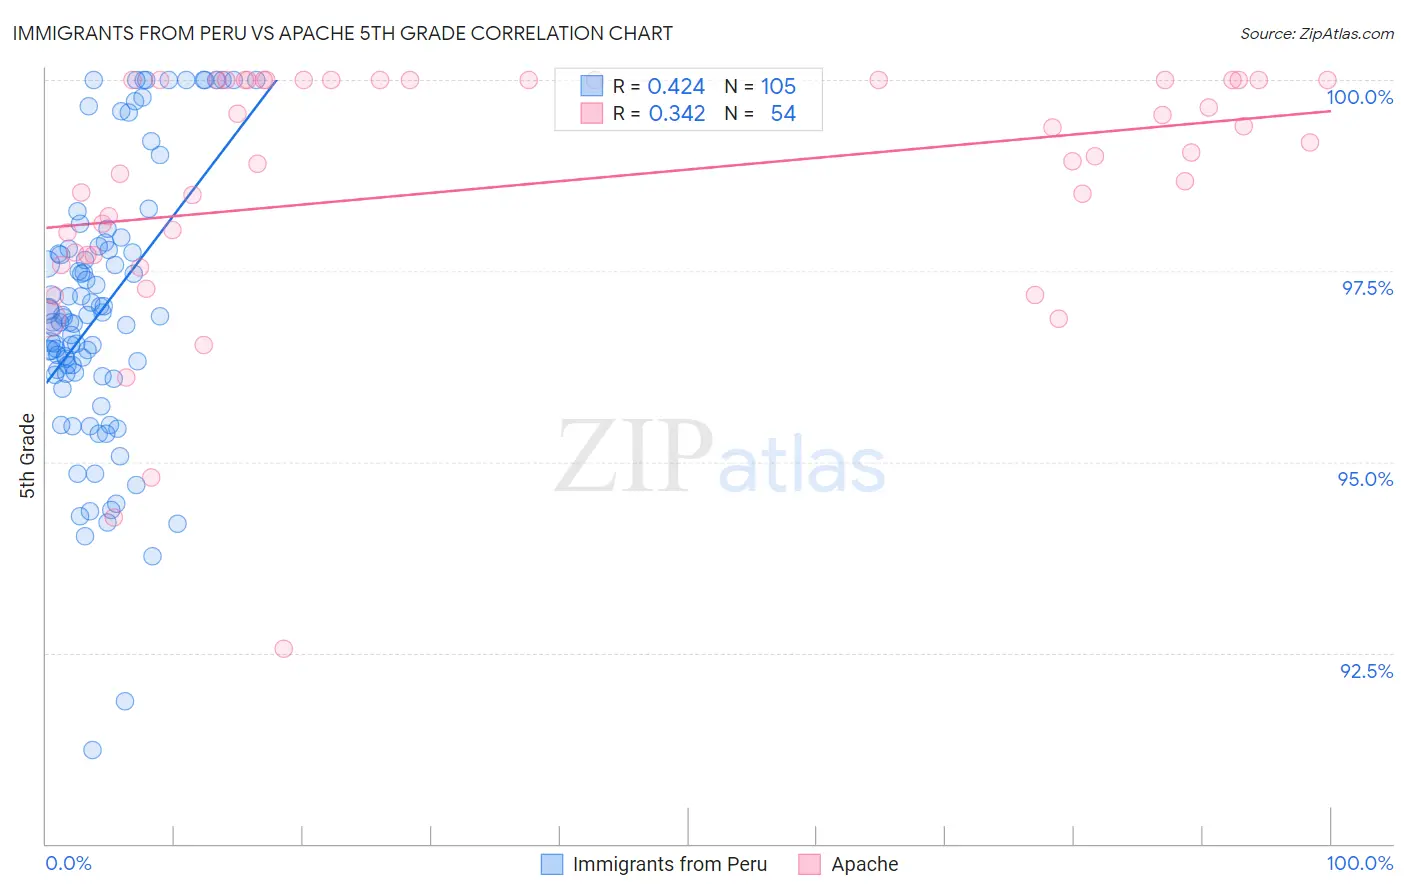
Immigrants from Peru vs Apache 5th Grade Correlation Chart

The statistical analysis conducted on geographies consisting of 328,685,754 people shows a moderate positive correlation between the proportion of Immigrants from Peru and percentage of population with at least 5th grade education in the United States with a correlation coefficient (R) of 0.424 and weighted average of 96.6%. Similarly, the statistical analysis conducted on geographies consisting of 231,142,814 people shows a mild positive correlation between the proportion of Apache and percentage of population with at least 5th grade education in the United States with a correlation coefficient (R) of 0.342 and weighted average of 97.4%, a difference of 0.74%.
Immigrants from Peru vs Apache 5th Grade

5th Grade Correlation Summary

MeasurementImmigrants from PeruApache
Minimum91.2%92.5%
Maximum100.0%100.0%
Range8.8%7.5%
Mean97.0%98.6%
Median96.9%99.0%
Interquartile 25% (IQ1)96.2%97.7%
Interquartile 75% (IQ3)97.8%100.0%
Interquartile Range (IQR)1.7%2.3%
Standard Deviation (Sample)1.8%1.6%
Standard Deviation (Population)1.8%1.6%

Similar Demographics by 5th Grade

Demographics Similar to Immigrants from Peru by 5th Grade

In terms of 5th grade, the demographic groups most similar to Immigrants from Peru are Cuban (96.6%, a difference of 0.0%), Immigrants from Bolivia (96.6%, a difference of 0.0%), Yaqui (96.7%, a difference of 0.010%), Immigrants from Cameroon (96.7%, a difference of 0.010%), and Immigrants from Ghana (96.6%, a difference of 0.010%).
DemographicsRating | Rank5th Grade
Armenians
0.3
/100
|
#268
Tragic
96.7%
Ghanaians
0.2
/100
|
#269
Tragic
96.7%
Afghans
0.2
/100
|
#270
Tragic
96.7%
Immigrants | Hong Kong
0.2
/100
|
#271
Tragic
96.7%
Trinidadians and Tobagonians
0.1
/100
|
#272
Tragic
96.7%
Yaqui
0.1
/100
|
#273
Tragic
96.7%
Immigrants | Cameroon
0.1
/100
|
#274
Tragic
96.7%
Immigrants | Peru
0.1
/100
|
#275
Tragic
96.6%
Cubans
0.1
/100
|
#276
Tragic
96.6%
Immigrants | Bolivia
0.1
/100
|
#277
Tragic
96.6%
Immigrants | Ghana
0.1
/100
|
#278
Tragic
96.6%
Immigrants | Philippines
0.1
/100
|
#279
Tragic
96.6%
Immigrants | Western Africa
0.1
/100
|
#280
Tragic
96.6%
Houma
0.1
/100
|
#281
Tragic
96.6%
Barbadians
0.1
/100
|
#282
Tragic
96.6%

Demographics Similar to Apache by 5th Grade

In terms of 5th grade, the demographic groups most similar to Apache are Immigrants from Poland (97.4%, a difference of 0.0%), Kenyan (97.4%, a difference of 0.010%), Immigrants from Iran (97.4%, a difference of 0.010%), Ugandan (97.4%, a difference of 0.010%), and Bermudan (97.4%, a difference of 0.010%).
DemographicsRating | Rank5th Grade
Immigrants | Italy
65.2
/100
|
#159
Good
97.4%
Marshallese
61.2
/100
|
#160
Good
97.4%
Kenyans
59.7
/100
|
#161
Average
97.4%
Immigrants | Iran
59.5
/100
|
#162
Average
97.4%
Ugandans
58.9
/100
|
#163
Average
97.4%
Bermudans
58.8
/100
|
#164
Average
97.4%
Immigrants | Poland
57.9
/100
|
#165
Average
97.4%
Apache
57.2
/100
|
#166
Average
97.4%
Immigrants | Belarus
54.6
/100
|
#167
Average
97.3%
Chileans
54.5
/100
|
#168
Average
97.3%
Immigrants | Korea
54.1
/100
|
#169
Average
97.3%
Venezuelans
54.0
/100
|
#170
Average
97.3%
Immigrants | Sri Lanka
53.8
/100
|
#171
Average
97.3%
Arabs
53.4
/100
|
#172
Average
97.3%
Egyptians
52.4
/100
|
#173
Average
97.3%