Immigrants from Panama vs Immigrants from Middle Africa Master's Degree
COMPARE
Immigrants from Panama
Immigrants from Middle Africa
Master's Degree
Master's Degree Comparison
Immigrants from Panama
Immigrants from Middle Africa
14.3%
MASTER'S DEGREE
20.0/ 100
METRIC RATING
209th/ 347
METRIC RANK
14.6%
MASTER'S DEGREE
33.6/ 100
METRIC RATING
192nd/ 347
METRIC RANK
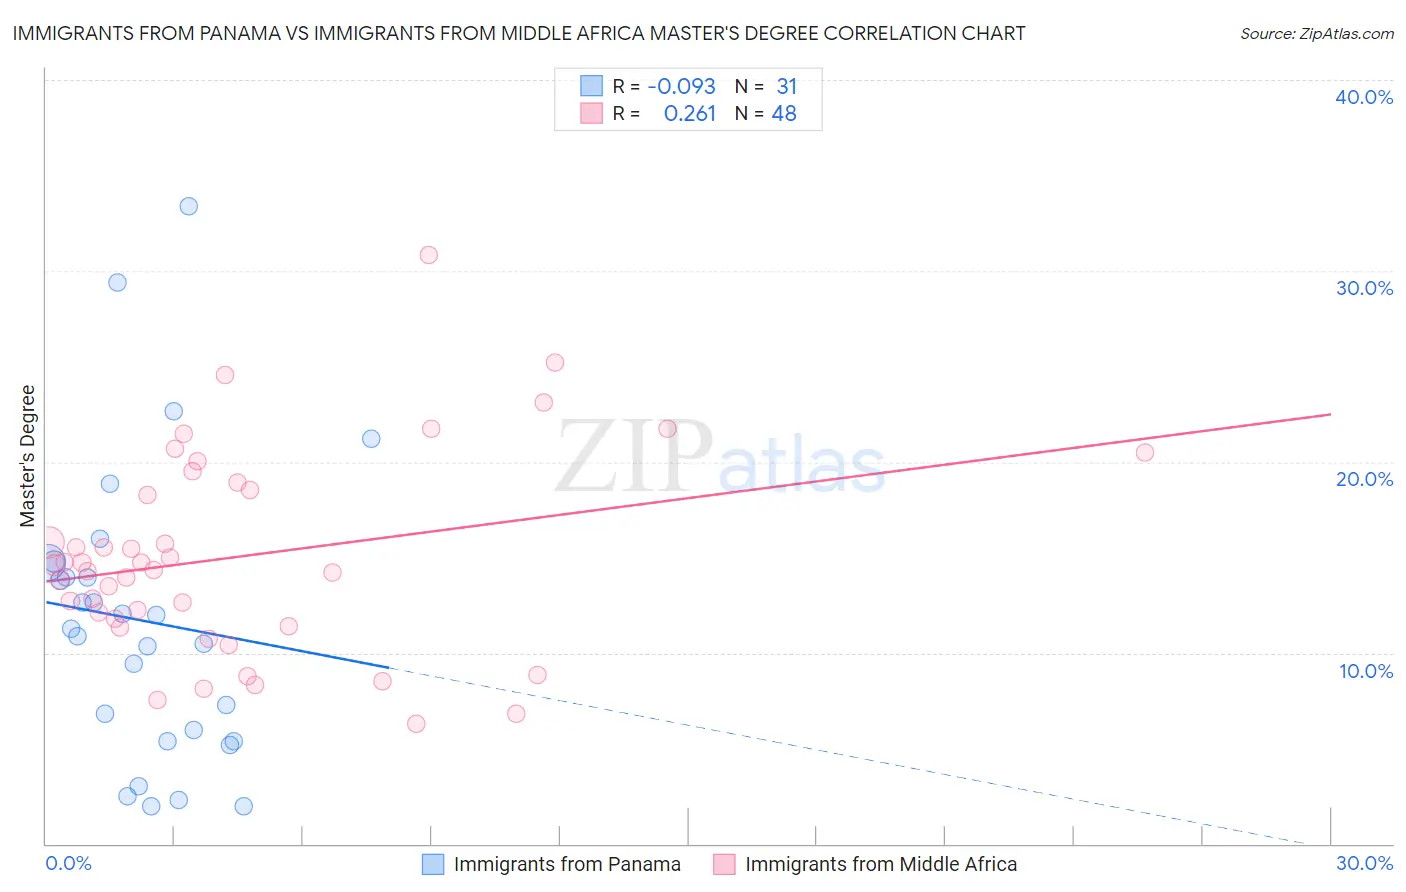
Immigrants from Panama vs Immigrants from Middle Africa Master's Degree Correlation Chart
The statistical analysis conducted on geographies consisting of 221,161,051 people shows a slight negative correlation between the proportion of Immigrants from Panama and percentage of population with at least master's degree education in the United States with a correlation coefficient (R) of -0.093 and weighted average of 14.3%. Similarly, the statistical analysis conducted on geographies consisting of 202,718,309 people shows a weak positive correlation between the proportion of Immigrants from Middle Africa and percentage of population with at least master's degree education in the United States with a correlation coefficient (R) of 0.261 and weighted average of 14.6%, a difference of 2.4%.
Master's Degree Correlation Summary
| Measurement | Immigrants from Panama | Immigrants from Middle Africa |
| Minimum | 1.9% | 6.3% |
| Maximum | 33.4% | 30.8% |
| Range | 31.4% | 24.5% |
| Mean | 11.7% | 15.0% |
| Median | 11.3% | 14.5% |
| Interquartile 25% (IQ1) | 5.4% | 11.6% |
| Interquartile 75% (IQ3) | 14.7% | 18.7% |
| Interquartile Range (IQR) | 9.4% | 7.1% |
| Standard Deviation (Sample) | 7.6% | 5.3% |
| Standard Deviation (Population) | 7.5% | 5.2% |
Demographics Similar to Immigrants from Panama and Immigrants from Middle Africa by Master's Degree
In terms of master's degree, the demographic groups most similar to Immigrants from Panama are Immigrants from Barbados (14.3%, a difference of 0.090%), Subsaharan African (14.2%, a difference of 0.13%), Immigrants from Bosnia and Herzegovina (14.3%, a difference of 0.39%), Scandinavian (14.4%, a difference of 0.64%), and Trinidadian and Tobagonian (14.4%, a difference of 0.68%). Similarly, the demographic groups most similar to Immigrants from Middle Africa are Welsh (14.6%, a difference of 0.090%), Immigrants from Nigeria (14.6%, a difference of 0.13%), Chinese (14.6%, a difference of 0.17%), Spaniard (14.6%, a difference of 0.31%), and Danish (14.5%, a difference of 0.35%).
| Demographics | Rating | Rank | Master's Degree |
| Spaniards | 35.8 /100 | #190 | Fair 14.6% |
| Welsh | 34.2 /100 | #191 | Fair 14.6% |
| Immigrants | Middle Africa | 33.6 /100 | #192 | Fair 14.6% |
| Immigrants | Nigeria | 32.7 /100 | #193 | Fair 14.6% |
| Chinese | 32.5 /100 | #194 | Fair 14.6% |
| Danes | 31.3 /100 | #195 | Fair 14.5% |
| Czechoslovakians | 29.9 /100 | #196 | Fair 14.5% |
| Belgians | 28.0 /100 | #197 | Fair 14.5% |
| West Indians | 27.4 /100 | #198 | Fair 14.5% |
| Immigrants | Armenia | 27.2 /100 | #199 | Fair 14.5% |
| Panamanians | 25.1 /100 | #200 | Fair 14.4% |
| Scotch-Irish | 25.0 /100 | #201 | Fair 14.4% |
| Immigrants | Western Africa | 24.9 /100 | #202 | Fair 14.4% |
| Yugoslavians | 24.3 /100 | #203 | Fair 14.4% |
| French | 23.7 /100 | #204 | Fair 14.4% |
| Trinidadians and Tobagonians | 23.5 /100 | #205 | Fair 14.4% |
| Scandinavians | 23.3 /100 | #206 | Fair 14.4% |
| Immigrants | Bosnia and Herzegovina | 22.0 /100 | #207 | Fair 14.3% |
| Immigrants | Barbados | 20.5 /100 | #208 | Fair 14.3% |
| Immigrants | Panama | 20.0 /100 | #209 | Fair 14.3% |
| Sub-Saharan Africans | 19.4 /100 | #210 | Poor 14.2% |