Immigrants from Pakistan vs Immigrants from North Macedonia Family Households with Children
COMPARE
Immigrants from Pakistan
Immigrants from North Macedonia
Family Households with Children
Family Households with Children Comparison
Immigrants from Pakistan
Immigrants from North Macedonia
30.2%
FAMILY HOUSEHOLDS WITH CHILDREN
100.0/ 100
METRIC RATING
12th/ 347
METRIC RANK
26.7%
FAMILY HOUSEHOLDS WITH CHILDREN
1.0/ 100
METRIC RATING
263rd/ 347
METRIC RANK
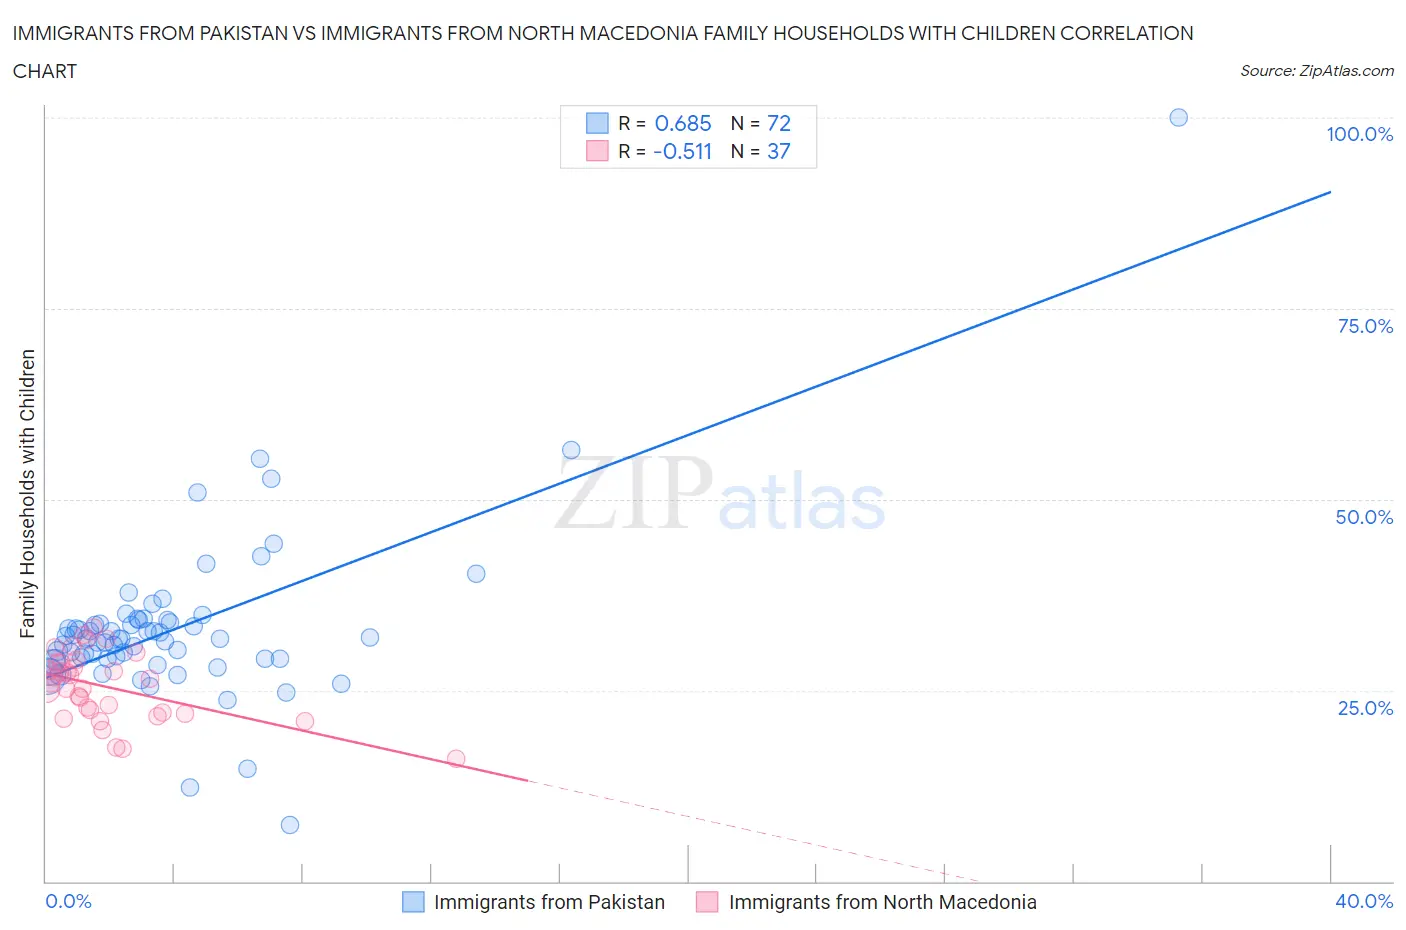
Immigrants from Pakistan vs Immigrants from North Macedonia Family Households with Children Correlation Chart
The statistical analysis conducted on geographies consisting of 283,710,080 people shows a significant positive correlation between the proportion of Immigrants from Pakistan and percentage of family households with children in the United States with a correlation coefficient (R) of 0.685 and weighted average of 30.2%. Similarly, the statistical analysis conducted on geographies consisting of 74,300,387 people shows a substantial negative correlation between the proportion of Immigrants from North Macedonia and percentage of family households with children in the United States with a correlation coefficient (R) of -0.511 and weighted average of 26.7%, a difference of 13.1%.
Family Households with Children Correlation Summary
| Measurement | Immigrants from Pakistan | Immigrants from North Macedonia |
| Minimum | 7.4% | 16.1% |
| Maximum | 100.0% | 33.3% |
| Range | 92.6% | 17.2% |
| Mean | 33.0% | 25.5% |
| Median | 31.8% | 26.0% |
| Interquartile 25% (IQ1) | 29.1% | 22.0% |
| Interquartile 75% (IQ3) | 34.0% | 28.6% |
| Interquartile Range (IQR) | 4.9% | 6.7% |
| Standard Deviation (Sample) | 11.1% | 4.4% |
| Standard Deviation (Population) | 11.0% | 4.3% |
Similar Demographics by Family Households with Children
Demographics Similar to Immigrants from Pakistan by Family Households with Children
In terms of family households with children, the demographic groups most similar to Immigrants from Pakistan are Afghan (30.2%, a difference of 0.24%), Bangladeshi (30.1%, a difference of 0.52%), Immigrants from South Central Asia (30.0%, a difference of 0.69%), Immigrants from Afghanistan (30.0%, a difference of 0.72%), and Nepalese (30.5%, a difference of 0.88%).
| Demographics | Rating | Rank | Family Households with Children |
| Tongans | 100.0 /100 | #5 | Exceptional 31.2% |
| Immigrants | India | 100.0 /100 | #6 | Exceptional 31.0% |
| Immigrants | Central America | 100.0 /100 | #7 | Exceptional 31.0% |
| Yakama | 100.0 /100 | #8 | Exceptional 30.8% |
| Thais | 100.0 /100 | #9 | Exceptional 30.6% |
| Immigrants | Fiji | 100.0 /100 | #10 | Exceptional 30.5% |
| Nepalese | 100.0 /100 | #11 | Exceptional 30.5% |
| Immigrants | Pakistan | 100.0 /100 | #12 | Exceptional 30.2% |
| Afghans | 100.0 /100 | #13 | Exceptional 30.2% |
| Bangladeshis | 100.0 /100 | #14 | Exceptional 30.1% |
| Immigrants | South Central Asia | 100.0 /100 | #15 | Exceptional 30.0% |
| Immigrants | Afghanistan | 100.0 /100 | #16 | Exceptional 30.0% |
| Hispanics or Latinos | 100.0 /100 | #17 | Exceptional 29.9% |
| Salvadorans | 100.0 /100 | #18 | Exceptional 29.9% |
| Alaska Natives | 100.0 /100 | #19 | Exceptional 29.9% |
Demographics Similar to Immigrants from North Macedonia by Family Households with Children
In terms of family households with children, the demographic groups most similar to Immigrants from North Macedonia are Immigrants from Russia (26.8%, a difference of 0.0%), Taiwanese (26.7%, a difference of 0.030%), Chippewa (26.7%, a difference of 0.040%), Maltese (26.7%, a difference of 0.050%), and Immigrants from Uzbekistan (26.7%, a difference of 0.050%).
| Demographics | Rating | Rank | Family Households with Children |
| Scotch-Irish | 1.4 /100 | #256 | Tragic 26.8% |
| Slavs | 1.3 /100 | #257 | Tragic 26.8% |
| Immigrants | Cuba | 1.3 /100 | #258 | Tragic 26.8% |
| Immigrants | Lithuania | 1.2 /100 | #259 | Tragic 26.8% |
| Immigrants | Jamaica | 1.2 /100 | #260 | Tragic 26.8% |
| Immigrants | Belarus | 1.1 /100 | #261 | Tragic 26.8% |
| Immigrants | Russia | 1.0 /100 | #262 | Tragic 26.8% |
| Immigrants | North Macedonia | 1.0 /100 | #263 | Tragic 26.7% |
| Taiwanese | 0.9 /100 | #264 | Tragic 26.7% |
| Chippewa | 0.9 /100 | #265 | Tragic 26.7% |
| Maltese | 0.9 /100 | #266 | Tragic 26.7% |
| Immigrants | Uzbekistan | 0.9 /100 | #267 | Tragic 26.7% |
| Immigrants | Belgium | 0.9 /100 | #268 | Tragic 26.7% |
| Immigrants | Denmark | 0.8 /100 | #269 | Tragic 26.7% |
| Immigrants | Zaire | 0.7 /100 | #270 | Tragic 26.7% |