Immigrants from Pakistan vs Immigrants from North Macedonia Married-couple Households
COMPARE
Immigrants from Pakistan
Immigrants from North Macedonia
Married-couple Households
Married-couple Households Comparison
Immigrants from Pakistan
Immigrants from North Macedonia
50.1%
MARRIED-COUPLE HOUSEHOLDS
100.0/ 100
METRIC RATING
11th/ 347
METRIC RANK
47.9%
MARRIED-COUPLE HOUSEHOLDS
96.4/ 100
METRIC RATING
98th/ 347
METRIC RANK
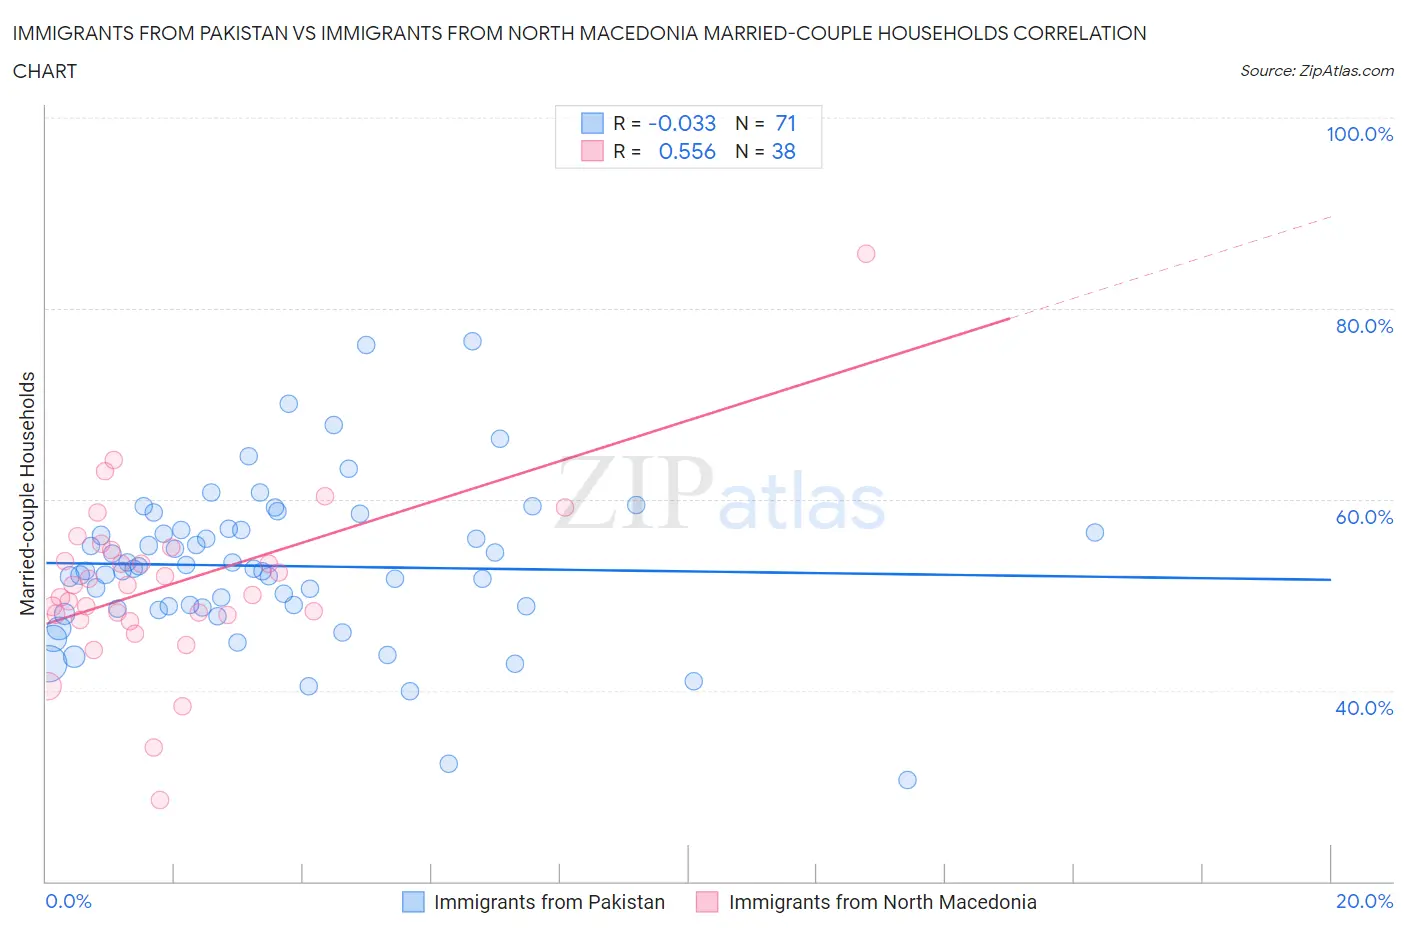
Immigrants from Pakistan vs Immigrants from North Macedonia Married-couple Households Correlation Chart
The statistical analysis conducted on geographies consisting of 283,790,790 people shows no correlation between the proportion of Immigrants from Pakistan and percentage of married-couple family households in the United States with a correlation coefficient (R) of -0.033 and weighted average of 50.1%. Similarly, the statistical analysis conducted on geographies consisting of 74,300,796 people shows a substantial positive correlation between the proportion of Immigrants from North Macedonia and percentage of married-couple family households in the United States with a correlation coefficient (R) of 0.556 and weighted average of 47.9%, a difference of 4.7%.
Married-couple Households Correlation Summary
| Measurement | Immigrants from Pakistan | Immigrants from North Macedonia |
| Minimum | 30.6% | 28.5% |
| Maximum | 76.6% | 85.7% |
| Range | 46.0% | 57.2% |
| Mean | 53.0% | 51.1% |
| Median | 52.8% | 50.5% |
| Interquartile 25% (IQ1) | 48.7% | 47.9% |
| Interquartile 75% (IQ3) | 56.7% | 54.8% |
| Interquartile Range (IQR) | 8.1% | 6.9% |
| Standard Deviation (Sample) | 8.2% | 9.2% |
| Standard Deviation (Population) | 8.2% | 9.0% |
Similar Demographics by Married-couple Households
Demographics Similar to Immigrants from Pakistan by Married-couple Households
In terms of married-couple households, the demographic groups most similar to Immigrants from Pakistan are Swiss (49.9%, a difference of 0.37%), Pennsylvania German (50.4%, a difference of 0.44%), Chinese (50.4%, a difference of 0.44%), Immigrants from Korea (49.9%, a difference of 0.54%), and Burmese (49.8%, a difference of 0.66%).
| Demographics | Rating | Rank | Married-couple Households |
| Assyrians/Chaldeans/Syriacs | 100.0 /100 | #4 | Exceptional 51.8% |
| Tongans | 100.0 /100 | #5 | Exceptional 51.6% |
| Danes | 100.0 /100 | #6 | Exceptional 51.1% |
| Filipinos | 100.0 /100 | #7 | Exceptional 51.0% |
| Immigrants | South Central Asia | 100.0 /100 | #8 | Exceptional 50.6% |
| Pennsylvania Germans | 100.0 /100 | #9 | Exceptional 50.4% |
| Chinese | 100.0 /100 | #10 | Exceptional 50.4% |
| Immigrants | Pakistan | 100.0 /100 | #11 | Exceptional 50.1% |
| Swiss | 100.0 /100 | #12 | Exceptional 49.9% |
| Immigrants | Korea | 100.0 /100 | #13 | Exceptional 49.9% |
| Burmese | 100.0 /100 | #14 | Exceptional 49.8% |
| Koreans | 99.9 /100 | #15 | Exceptional 49.7% |
| Swedes | 99.9 /100 | #16 | Exceptional 49.7% |
| Immigrants | Hong Kong | 99.9 /100 | #17 | Exceptional 49.6% |
| English | 99.9 /100 | #18 | Exceptional 49.6% |
Demographics Similar to Immigrants from North Macedonia by Married-couple Households
In terms of married-couple households, the demographic groups most similar to Immigrants from North Macedonia are Latvian (47.9%, a difference of 0.010%), Immigrants from Austria (47.9%, a difference of 0.010%), Immigrants from Italy (47.9%, a difference of 0.020%), Immigrants from Egypt (47.9%, a difference of 0.040%), and Turkish (47.8%, a difference of 0.080%).
| Demographics | Rating | Rank | Married-couple Households |
| Immigrants | Moldova | 97.0 /100 | #91 | Exceptional 48.0% |
| Palestinians | 96.9 /100 | #92 | Exceptional 48.0% |
| Lebanese | 96.9 /100 | #93 | Exceptional 47.9% |
| Americans | 96.9 /100 | #94 | Exceptional 47.9% |
| Immigrants | Belgium | 96.8 /100 | #95 | Exceptional 47.9% |
| Immigrants | Egypt | 96.6 /100 | #96 | Exceptional 47.9% |
| Latvians | 96.5 /100 | #97 | Exceptional 47.9% |
| Immigrants | North Macedonia | 96.4 /100 | #98 | Exceptional 47.9% |
| Immigrants | Austria | 96.4 /100 | #99 | Exceptional 47.9% |
| Immigrants | Italy | 96.3 /100 | #100 | Exceptional 47.9% |
| Turks | 96.1 /100 | #101 | Exceptional 47.8% |
| Slavs | 96.0 /100 | #102 | Exceptional 47.8% |
| Hawaiians | 96.0 /100 | #103 | Exceptional 47.8% |
| Immigrants | South Africa | 96.0 /100 | #104 | Exceptional 47.8% |
| Immigrants | Czechoslovakia | 95.5 /100 | #105 | Exceptional 47.8% |