Immigrants from Pakistan vs Apache 9th Grade
COMPARE
Immigrants from Pakistan
Apache
9th Grade
9th Grade Comparison
Immigrants from Pakistan
Apache
94.6%
9TH GRADE
15.5/ 100
METRIC RATING
208th/ 347
METRIC RANK
94.3%
9TH GRADE
4.2/ 100
METRIC RATING
230th/ 347
METRIC RANK
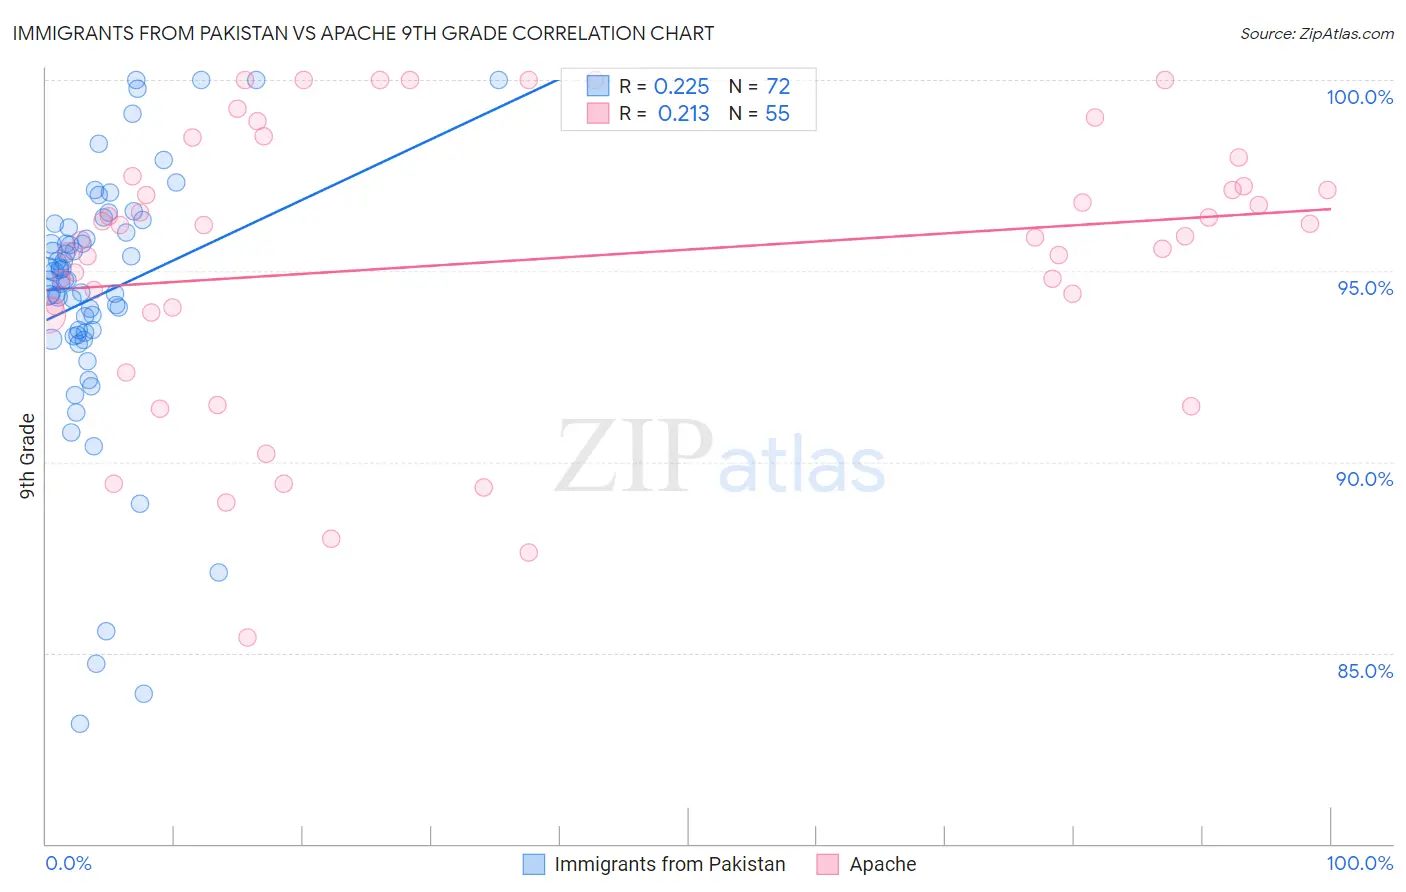
Immigrants from Pakistan vs Apache 9th Grade Correlation Chart
The statistical analysis conducted on geographies consisting of 283,862,965 people shows a weak positive correlation between the proportion of Immigrants from Pakistan and percentage of population with at least 9th grade education in the United States with a correlation coefficient (R) of 0.225 and weighted average of 94.6%. Similarly, the statistical analysis conducted on geographies consisting of 231,142,637 people shows a weak positive correlation between the proportion of Apache and percentage of population with at least 9th grade education in the United States with a correlation coefficient (R) of 0.213 and weighted average of 94.3%, a difference of 0.27%.
9th Grade Correlation Summary
| Measurement | Immigrants from Pakistan | Apache |
| Minimum | 83.1% | 85.4% |
| Maximum | 100.0% | 100.0% |
| Range | 16.9% | 14.6% |
| Mean | 94.4% | 95.3% |
| Median | 94.8% | 95.9% |
| Interquartile 25% (IQ1) | 93.4% | 93.9% |
| Interquartile 75% (IQ3) | 96.1% | 97.5% |
| Interquartile Range (IQR) | 2.7% | 3.6% |
| Standard Deviation (Sample) | 3.4% | 3.6% |
| Standard Deviation (Population) | 3.4% | 3.6% |
Similar Demographics by 9th Grade
Demographics Similar to Immigrants from Pakistan by 9th Grade
In terms of 9th grade, the demographic groups most similar to Immigrants from Pakistan are Immigrants from Morocco (94.6%, a difference of 0.010%), Comanche (94.6%, a difference of 0.010%), Samoan (94.6%, a difference of 0.020%), Immigrants from Sudan (94.6%, a difference of 0.030%), and Immigrants from Chile (94.5%, a difference of 0.030%).
| Demographics | Rating | Rank | 9th Grade |
| Blacks/African Americans | 20.5 /100 | #201 | Fair 94.6% |
| Immigrants | Eastern Asia | 19.8 /100 | #202 | Poor 94.6% |
| Immigrants | Bahamas | 19.8 /100 | #203 | Poor 94.6% |
| Moroccans | 19.6 /100 | #204 | Poor 94.6% |
| Immigrants | Sudan | 17.6 /100 | #205 | Poor 94.6% |
| Samoans | 17.3 /100 | #206 | Poor 94.6% |
| Immigrants | Morocco | 16.3 /100 | #207 | Poor 94.6% |
| Immigrants | Pakistan | 15.5 /100 | #208 | Poor 94.6% |
| Comanche | 14.9 /100 | #209 | Poor 94.6% |
| Immigrants | Chile | 13.4 /100 | #210 | Poor 94.5% |
| Immigrants | Indonesia | 12.3 /100 | #211 | Poor 94.5% |
| Immigrants | Malaysia | 12.2 /100 | #212 | Poor 94.5% |
| Immigrants | Oceania | 12.1 /100 | #213 | Poor 94.5% |
| Immigrants | Liberia | 11.8 /100 | #214 | Poor 94.5% |
| Immigrants | Syria | 11.0 /100 | #215 | Poor 94.5% |
Demographics Similar to Apache by 9th Grade
In terms of 9th grade, the demographic groups most similar to Apache are Immigrants from Panama (94.3%, a difference of 0.010%), Immigrants from Africa (94.3%, a difference of 0.010%), Lumbee (94.4%, a difference of 0.020%), Immigrants from Southern Europe (94.3%, a difference of 0.020%), and Nigerian (94.3%, a difference of 0.020%).
| Demographics | Rating | Rank | 9th Grade |
| Bahamians | 7.0 /100 | #223 | Tragic 94.4% |
| Tongans | 6.0 /100 | #224 | Tragic 94.4% |
| Ethiopians | 5.4 /100 | #225 | Tragic 94.4% |
| Sub-Saharan Africans | 5.4 /100 | #226 | Tragic 94.4% |
| Immigrants | Sierra Leone | 4.8 /100 | #227 | Tragic 94.4% |
| Lumbee | 4.7 /100 | #228 | Tragic 94.4% |
| Immigrants | Southern Europe | 4.5 /100 | #229 | Tragic 94.3% |
| Apache | 4.2 /100 | #230 | Tragic 94.3% |
| Immigrants | Panama | 4.0 /100 | #231 | Tragic 94.3% |
| Immigrants | Africa | 3.9 /100 | #232 | Tragic 94.3% |
| Nigerians | 3.7 /100 | #233 | Tragic 94.3% |
| Costa Ricans | 3.5 /100 | #234 | Tragic 94.3% |
| Bolivians | 3.3 /100 | #235 | Tragic 94.3% |
| Somalis | 2.9 /100 | #236 | Tragic 94.3% |
| Koreans | 2.9 /100 | #237 | Tragic 94.3% |