Immigrants from Oceania vs Scotch-Irish Per Capita Income
COMPARE
Immigrants from Oceania
Scotch-Irish
Per Capita Income
Per Capita Income Comparison
Immigrants from Oceania
Scotch-Irish
$45,220
PER CAPITA INCOME
85.2/ 100
METRIC RATING
136th/ 347
METRIC RANK
$42,563
PER CAPITA INCOME
22.6/ 100
METRIC RATING
197th/ 347
METRIC RANK
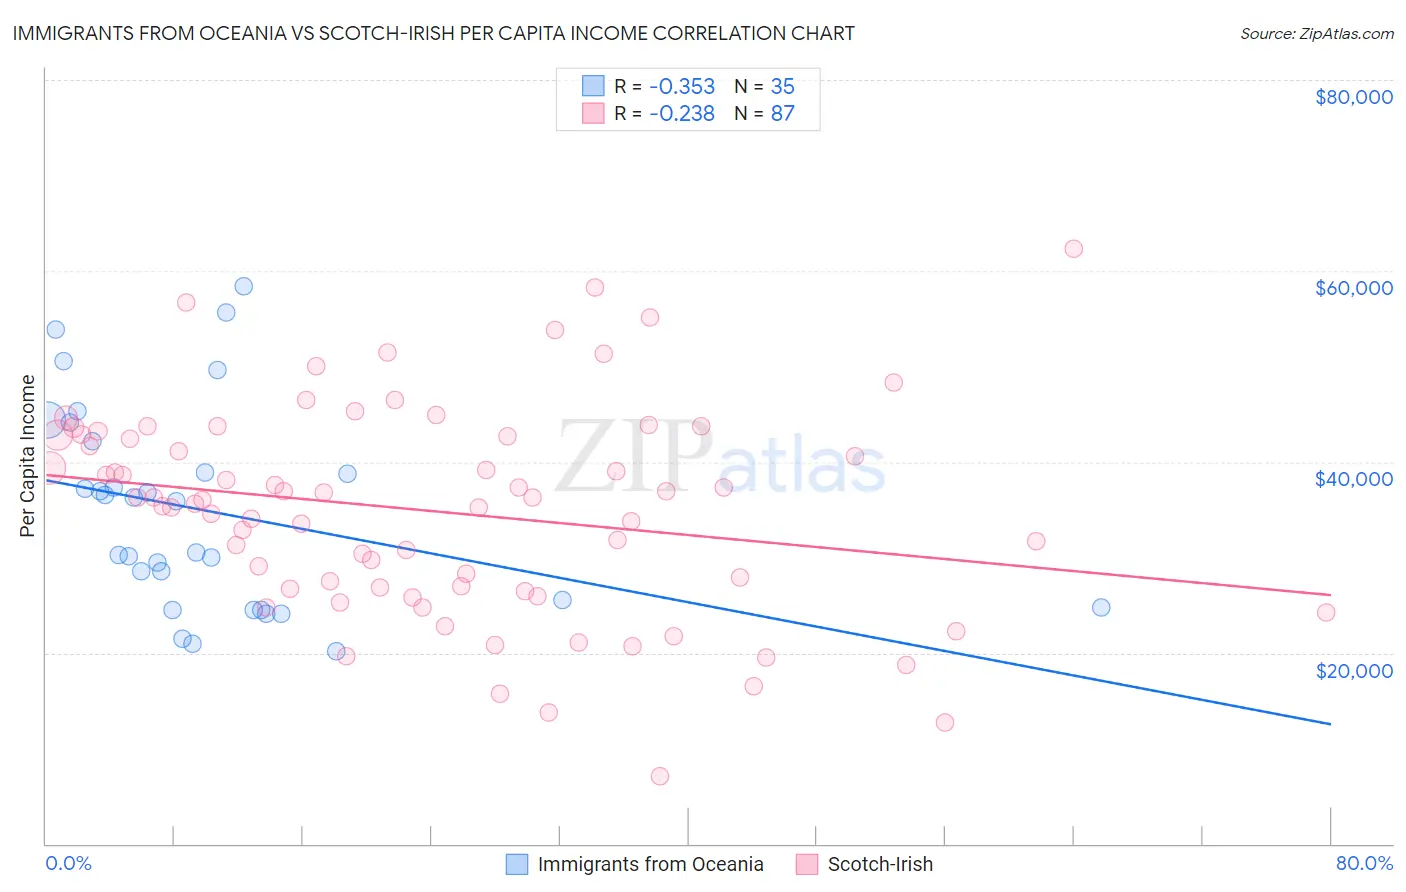
Immigrants from Oceania vs Scotch-Irish Per Capita Income Correlation Chart
The statistical analysis conducted on geographies consisting of 305,528,367 people shows a mild negative correlation between the proportion of Immigrants from Oceania and per capita income in the United States with a correlation coefficient (R) of -0.353 and weighted average of $45,220. Similarly, the statistical analysis conducted on geographies consisting of 548,816,006 people shows a weak negative correlation between the proportion of Scotch-Irish and per capita income in the United States with a correlation coefficient (R) of -0.238 and weighted average of $42,563, a difference of 6.2%.
Per Capita Income Correlation Summary
| Measurement | Immigrants from Oceania | Scotch-Irish |
| Minimum | $20,128 | $7,124 |
| Maximum | $58,378 | $62,377 |
| Range | $38,250 | $55,253 |
| Mean | $34,877 | $34,830 |
| Median | $35,881 | $35,981 |
| Interquartile 25% (IQ1) | $24,699 | $26,689 |
| Interquartile 75% (IQ3) | $42,218 | $42,802 |
| Interquartile Range (IQR) | $17,519 | $16,113 |
| Standard Deviation (Sample) | $10,480 | $10,987 |
| Standard Deviation (Population) | $10,330 | $10,923 |
Similar Demographics by Per Capita Income
Demographics Similar to Immigrants from Oceania by Per Capita Income
In terms of per capita income, the demographic groups most similar to Immigrants from Oceania are Immigrants from Syria ($45,218, a difference of 0.0%), Assyrian/Chaldean/Syriac ($45,195, a difference of 0.060%), Basque ($45,086, a difference of 0.30%), Immigrants from Jordan ($45,066, a difference of 0.34%), and Slavic ($45,049, a difference of 0.38%).
| Demographics | Rating | Rank | Per Capita Income |
| Luxembourgers | 90.4 /100 | #129 | Exceptional $45,663 |
| Arabs | 90.4 /100 | #130 | Exceptional $45,662 |
| Immigrants | North Macedonia | 90.0 /100 | #131 | Exceptional $45,622 |
| Jordanians | 89.9 /100 | #132 | Excellent $45,605 |
| Pakistanis | 89.7 /100 | #133 | Excellent $45,587 |
| Slovenes | 89.6 /100 | #134 | Excellent $45,581 |
| Hungarians | 87.9 /100 | #135 | Excellent $45,426 |
| Immigrants | Oceania | 85.2 /100 | #136 | Excellent $45,220 |
| Immigrants | Syria | 85.2 /100 | #137 | Excellent $45,218 |
| Assyrians/Chaldeans/Syriacs | 84.8 /100 | #138 | Excellent $45,195 |
| Basques | 83.2 /100 | #139 | Excellent $45,086 |
| Immigrants | Jordan | 82.9 /100 | #140 | Excellent $45,066 |
| Slavs | 82.6 /100 | #141 | Excellent $45,049 |
| Ugandans | 82.6 /100 | #142 | Excellent $45,047 |
| Immigrants | Uganda | 82.5 /100 | #143 | Excellent $45,043 |
Demographics Similar to Scotch-Irish by Per Capita Income
In terms of per capita income, the demographic groups most similar to Scotch-Irish are Dutch ($42,605, a difference of 0.10%), Immigrants from Kenya ($42,661, a difference of 0.23%), Immigrants from Fiji ($42,694, a difference of 0.31%), Immigrants from Portugal ($42,412, a difference of 0.36%), and Barbadian ($42,406, a difference of 0.37%).
| Demographics | Rating | Rank | Per Capita Income |
| Kenyans | 27.7 /100 | #190 | Fair $42,808 |
| Yugoslavians | 27.4 /100 | #191 | Fair $42,792 |
| Iraqis | 26.7 /100 | #192 | Fair $42,760 |
| Immigrants | Sierra Leone | 26.5 /100 | #193 | Fair $42,752 |
| Immigrants | Fiji | 25.2 /100 | #194 | Fair $42,694 |
| Immigrants | Kenya | 24.5 /100 | #195 | Fair $42,661 |
| Dutch | 23.4 /100 | #196 | Fair $42,605 |
| Scotch-Irish | 22.6 /100 | #197 | Fair $42,563 |
| Immigrants | Portugal | 19.7 /100 | #198 | Poor $42,412 |
| Barbadians | 19.6 /100 | #199 | Poor $42,406 |
| Vietnamese | 19.0 /100 | #200 | Poor $42,368 |
| Immigrants | Thailand | 17.6 /100 | #201 | Poor $42,289 |
| Immigrants | Bosnia and Herzegovina | 17.5 /100 | #202 | Poor $42,278 |
| Spanish | 17.0 /100 | #203 | Poor $42,249 |
| Aleuts | 16.4 /100 | #204 | Poor $42,210 |