Immigrants from Oceania vs Central American Indian Per Capita Income
COMPARE
Immigrants from Oceania
Central American Indian
Per Capita Income
Per Capita Income Comparison
Immigrants from Oceania
Central American Indians
$45,220
PER CAPITA INCOME
85.2/ 100
METRIC RATING
136th/ 347
METRIC RANK
$37,699
PER CAPITA INCOME
0.1/ 100
METRIC RATING
286th/ 347
METRIC RANK
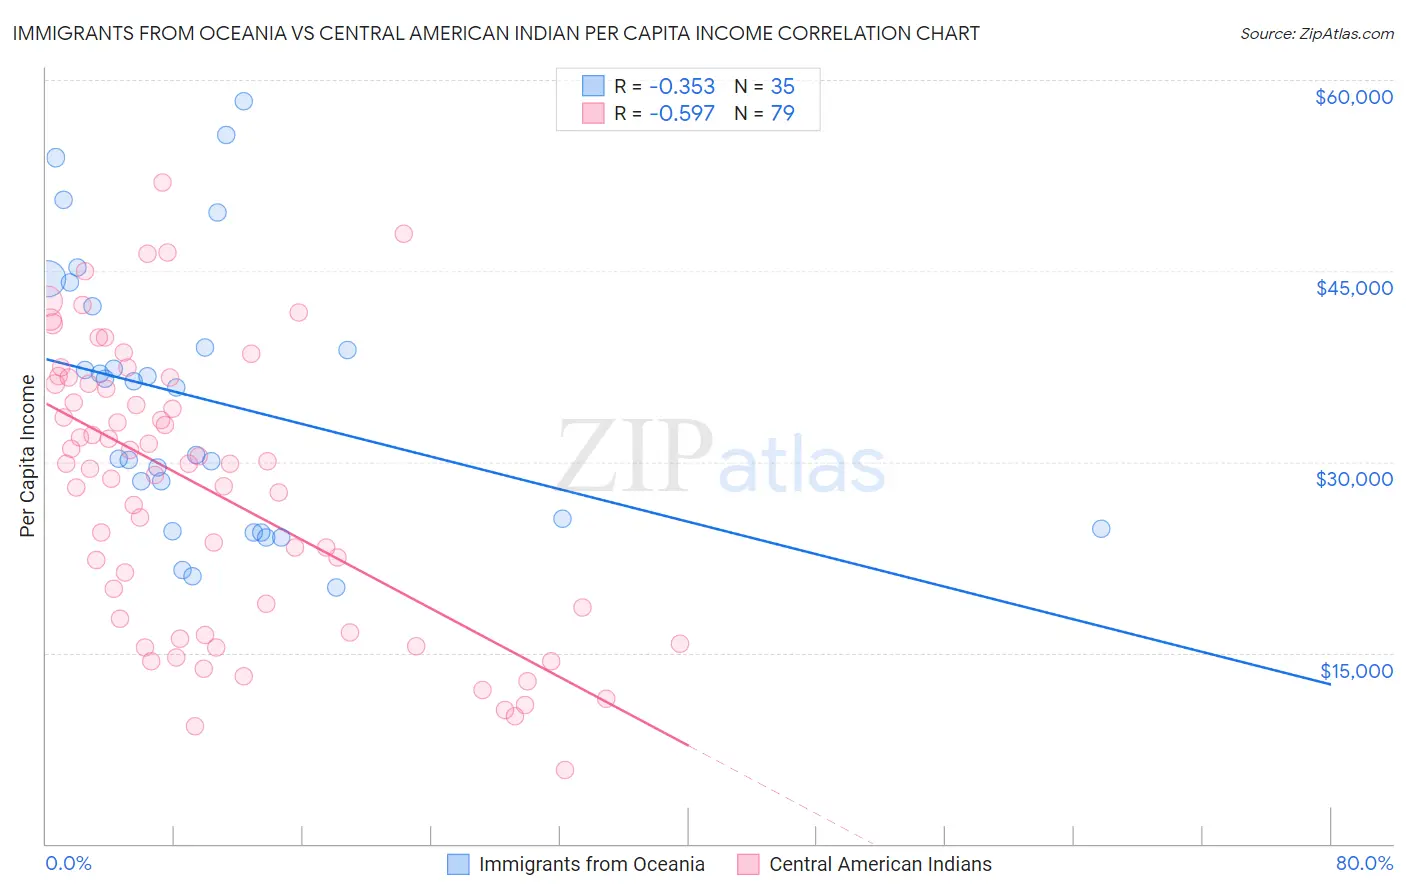
Immigrants from Oceania vs Central American Indian Per Capita Income Correlation Chart
The statistical analysis conducted on geographies consisting of 305,528,367 people shows a mild negative correlation between the proportion of Immigrants from Oceania and per capita income in the United States with a correlation coefficient (R) of -0.353 and weighted average of $45,220. Similarly, the statistical analysis conducted on geographies consisting of 326,146,034 people shows a substantial negative correlation between the proportion of Central American Indians and per capita income in the United States with a correlation coefficient (R) of -0.597 and weighted average of $37,699, a difference of 20.0%.
Per Capita Income Correlation Summary
| Measurement | Immigrants from Oceania | Central American Indian |
| Minimum | $20,128 | $5,814 |
| Maximum | $58,378 | $51,916 |
| Range | $38,250 | $46,102 |
| Mean | $34,877 | $27,773 |
| Median | $35,881 | $29,805 |
| Interquartile 25% (IQ1) | $24,699 | $16,640 |
| Interquartile 75% (IQ3) | $42,218 | $36,169 |
| Interquartile Range (IQR) | $17,519 | $19,529 |
| Standard Deviation (Sample) | $10,480 | $10,964 |
| Standard Deviation (Population) | $10,330 | $10,894 |
Similar Demographics by Per Capita Income
Demographics Similar to Immigrants from Oceania by Per Capita Income
In terms of per capita income, the demographic groups most similar to Immigrants from Oceania are Immigrants from Syria ($45,218, a difference of 0.0%), Assyrian/Chaldean/Syriac ($45,195, a difference of 0.060%), Basque ($45,086, a difference of 0.30%), Immigrants from Jordan ($45,066, a difference of 0.34%), and Slavic ($45,049, a difference of 0.38%).
| Demographics | Rating | Rank | Per Capita Income |
| Luxembourgers | 90.4 /100 | #129 | Exceptional $45,663 |
| Arabs | 90.4 /100 | #130 | Exceptional $45,662 |
| Immigrants | North Macedonia | 90.0 /100 | #131 | Exceptional $45,622 |
| Jordanians | 89.9 /100 | #132 | Excellent $45,605 |
| Pakistanis | 89.7 /100 | #133 | Excellent $45,587 |
| Slovenes | 89.6 /100 | #134 | Excellent $45,581 |
| Hungarians | 87.9 /100 | #135 | Excellent $45,426 |
| Immigrants | Oceania | 85.2 /100 | #136 | Excellent $45,220 |
| Immigrants | Syria | 85.2 /100 | #137 | Excellent $45,218 |
| Assyrians/Chaldeans/Syriacs | 84.8 /100 | #138 | Excellent $45,195 |
| Basques | 83.2 /100 | #139 | Excellent $45,086 |
| Immigrants | Jordan | 82.9 /100 | #140 | Excellent $45,066 |
| Slavs | 82.6 /100 | #141 | Excellent $45,049 |
| Ugandans | 82.6 /100 | #142 | Excellent $45,047 |
| Immigrants | Uganda | 82.5 /100 | #143 | Excellent $45,043 |
Demographics Similar to Central American Indians by Per Capita Income
In terms of per capita income, the demographic groups most similar to Central American Indians are Dominican ($37,697, a difference of 0.010%), Blackfeet ($37,695, a difference of 0.010%), Guatemalan ($37,766, a difference of 0.18%), African ($37,785, a difference of 0.23%), and U.S. Virgin Islander ($37,589, a difference of 0.29%).
| Demographics | Rating | Rank | Per Capita Income |
| Colville | 0.2 /100 | #279 | Tragic $38,047 |
| Potawatomi | 0.2 /100 | #280 | Tragic $38,046 |
| Immigrants | Dominica | 0.2 /100 | #281 | Tragic $37,952 |
| Immigrants | Laos | 0.1 /100 | #282 | Tragic $37,857 |
| Pennsylvania Germans | 0.1 /100 | #283 | Tragic $37,842 |
| Africans | 0.1 /100 | #284 | Tragic $37,785 |
| Guatemalans | 0.1 /100 | #285 | Tragic $37,766 |
| Central American Indians | 0.1 /100 | #286 | Tragic $37,699 |
| Dominicans | 0.1 /100 | #287 | Tragic $37,697 |
| Blackfeet | 0.1 /100 | #288 | Tragic $37,695 |
| U.S. Virgin Islanders | 0.1 /100 | #289 | Tragic $37,589 |
| Immigrants | Guatemala | 0.1 /100 | #290 | Tragic $37,550 |
| Cajuns | 0.1 /100 | #291 | Tragic $37,527 |
| Immigrants | Micronesia | 0.1 /100 | #292 | Tragic $37,464 |
| Mexican American Indians | 0.1 /100 | #293 | Tragic $37,407 |