Immigrants from Norway vs Uruguayan 1 or more Vehicles in Household
COMPARE
Immigrants from Norway
Uruguayan
1 or more Vehicles in Household
1 or more Vehicles in Household Comparison
Immigrants from Norway
Uruguayans
88.7%
1 OR MORE VEHICLES IN HOUSEHOLD
5.5/ 100
METRIC RATING
228th/ 347
METRIC RANK
88.8%
1 OR MORE VEHICLES IN HOUSEHOLD
7.0/ 100
METRIC RATING
222nd/ 347
METRIC RANK
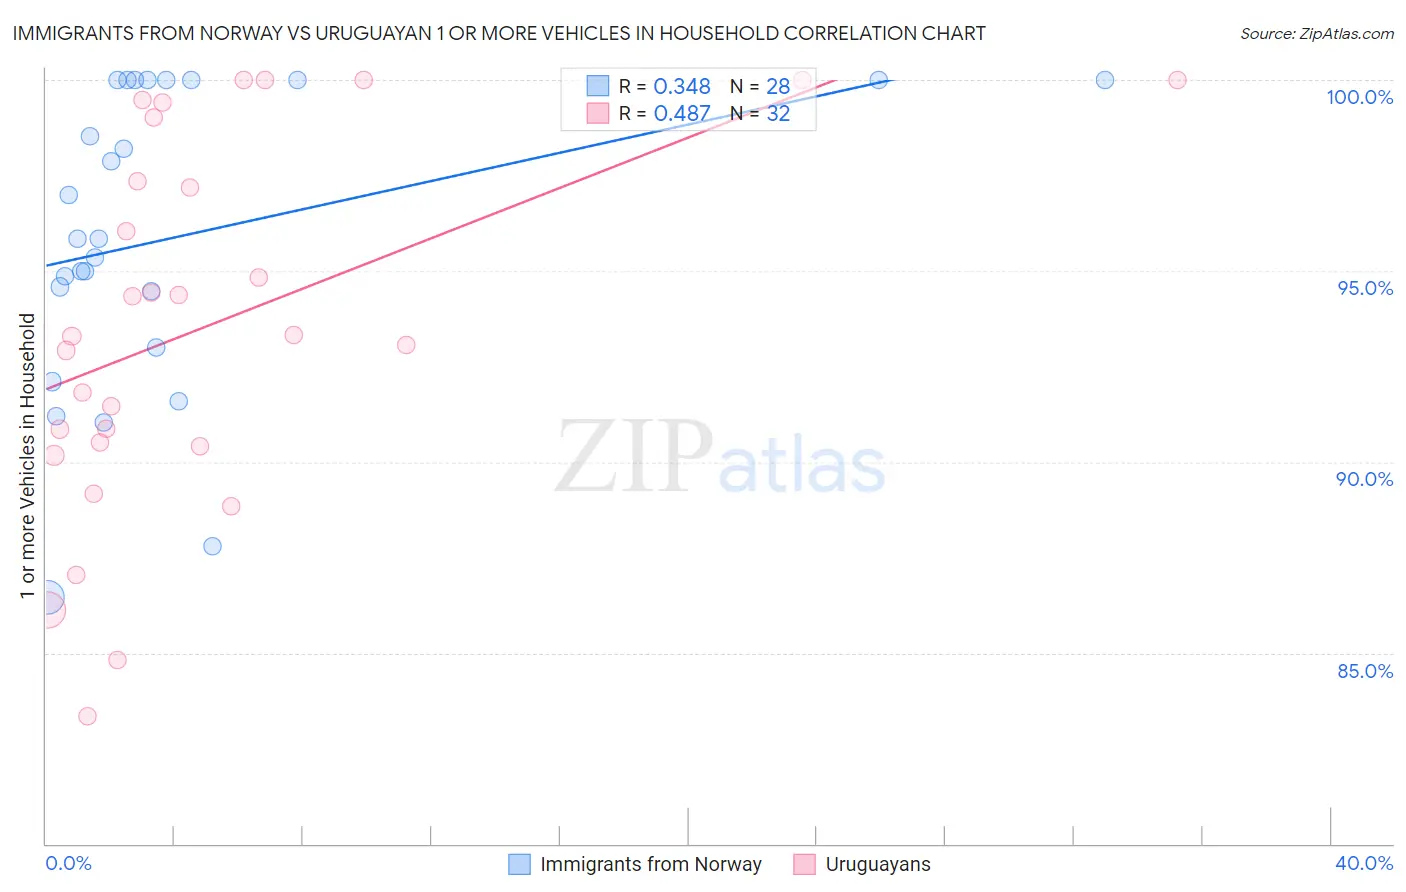
Immigrants from Norway vs Uruguayan 1 or more Vehicles in Household Correlation Chart
The statistical analysis conducted on geographies consisting of 116,609,414 people shows a mild positive correlation between the proportion of Immigrants from Norway and percentage of households with 1 or more vehicles available in the United States with a correlation coefficient (R) of 0.348 and weighted average of 88.7%. Similarly, the statistical analysis conducted on geographies consisting of 144,759,773 people shows a moderate positive correlation between the proportion of Uruguayans and percentage of households with 1 or more vehicles available in the United States with a correlation coefficient (R) of 0.487 and weighted average of 88.8%, a difference of 0.10%.
1 or more Vehicles in Household Correlation Summary
| Measurement | Immigrants from Norway | Uruguayan |
| Minimum | 86.5% | 83.3% |
| Maximum | 100.0% | 100.0% |
| Range | 13.5% | 16.7% |
| Mean | 95.9% | 93.6% |
| Median | 95.8% | 93.3% |
| Interquartile 25% (IQ1) | 93.7% | 90.4% |
| Interquartile 75% (IQ3) | 100.0% | 98.2% |
| Interquartile Range (IQR) | 6.3% | 7.7% |
| Standard Deviation (Sample) | 3.9% | 4.8% |
| Standard Deviation (Population) | 3.9% | 4.7% |
Demographics Similar to Immigrants from Norway and Uruguayans by 1 or more Vehicles in Household
In terms of 1 or more vehicles in household, the demographic groups most similar to Immigrants from Norway are Cheyenne (88.7%, a difference of 0.010%), Ute (88.7%, a difference of 0.010%), Immigrants from Romania (88.7%, a difference of 0.010%), Immigrants from Sierra Leone (88.7%, a difference of 0.030%), and Cree (88.7%, a difference of 0.040%). Similarly, the demographic groups most similar to Uruguayans are Immigrants from South America (88.8%, a difference of 0.0%), Peruvian (88.8%, a difference of 0.050%), Immigrants from Hong Kong (88.7%, a difference of 0.050%), Cree (88.7%, a difference of 0.060%), and Immigrants from Zaire (88.8%, a difference of 0.070%).
| Demographics | Rating | Rank | 1 or more Vehicles in Household |
| Immigrants | Sri Lanka | 10.2 /100 | #215 | Poor 88.9% |
| Immigrants | Argentina | 9.4 /100 | #216 | Tragic 88.9% |
| Argentineans | 8.8 /100 | #217 | Tragic 88.9% |
| Ugandans | 8.7 /100 | #218 | Tragic 88.9% |
| Immigrants | Guatemala | 8.6 /100 | #219 | Tragic 88.9% |
| Immigrants | Zaire | 8.1 /100 | #220 | Tragic 88.8% |
| Peruvians | 7.9 /100 | #221 | Tragic 88.8% |
| Uruguayans | 7.0 /100 | #222 | Tragic 88.8% |
| Immigrants | South America | 7.0 /100 | #223 | Tragic 88.8% |
| Immigrants | Hong Kong | 6.2 /100 | #224 | Tragic 88.7% |
| Cree | 6.0 /100 | #225 | Tragic 88.7% |
| Cheyenne | 5.7 /100 | #226 | Tragic 88.7% |
| Ute | 5.6 /100 | #227 | Tragic 88.7% |
| Immigrants | Norway | 5.5 /100 | #228 | Tragic 88.7% |
| Immigrants | Romania | 5.4 /100 | #229 | Tragic 88.7% |
| Immigrants | Sierra Leone | 5.2 /100 | #230 | Tragic 88.7% |
| Russians | 5.0 /100 | #231 | Tragic 88.7% |
| Immigrants | Japan | 4.9 /100 | #232 | Tragic 88.7% |
| Houma | 4.8 /100 | #233 | Tragic 88.6% |
| Immigrants | Peru | 4.7 /100 | #234 | Tragic 88.6% |
| Paiute | 4.6 /100 | #235 | Tragic 88.6% |