Immigrants from Norway vs Uruguayan 8th Grade
COMPARE
Immigrants from Norway
Uruguayan
8th Grade
8th Grade Comparison
Immigrants from Norway
Uruguayans
96.2%
8TH GRADE
95.7/ 100
METRIC RATING
118th/ 347
METRIC RANK
95.1%
8TH GRADE
1.2/ 100
METRIC RATING
248th/ 347
METRIC RANK
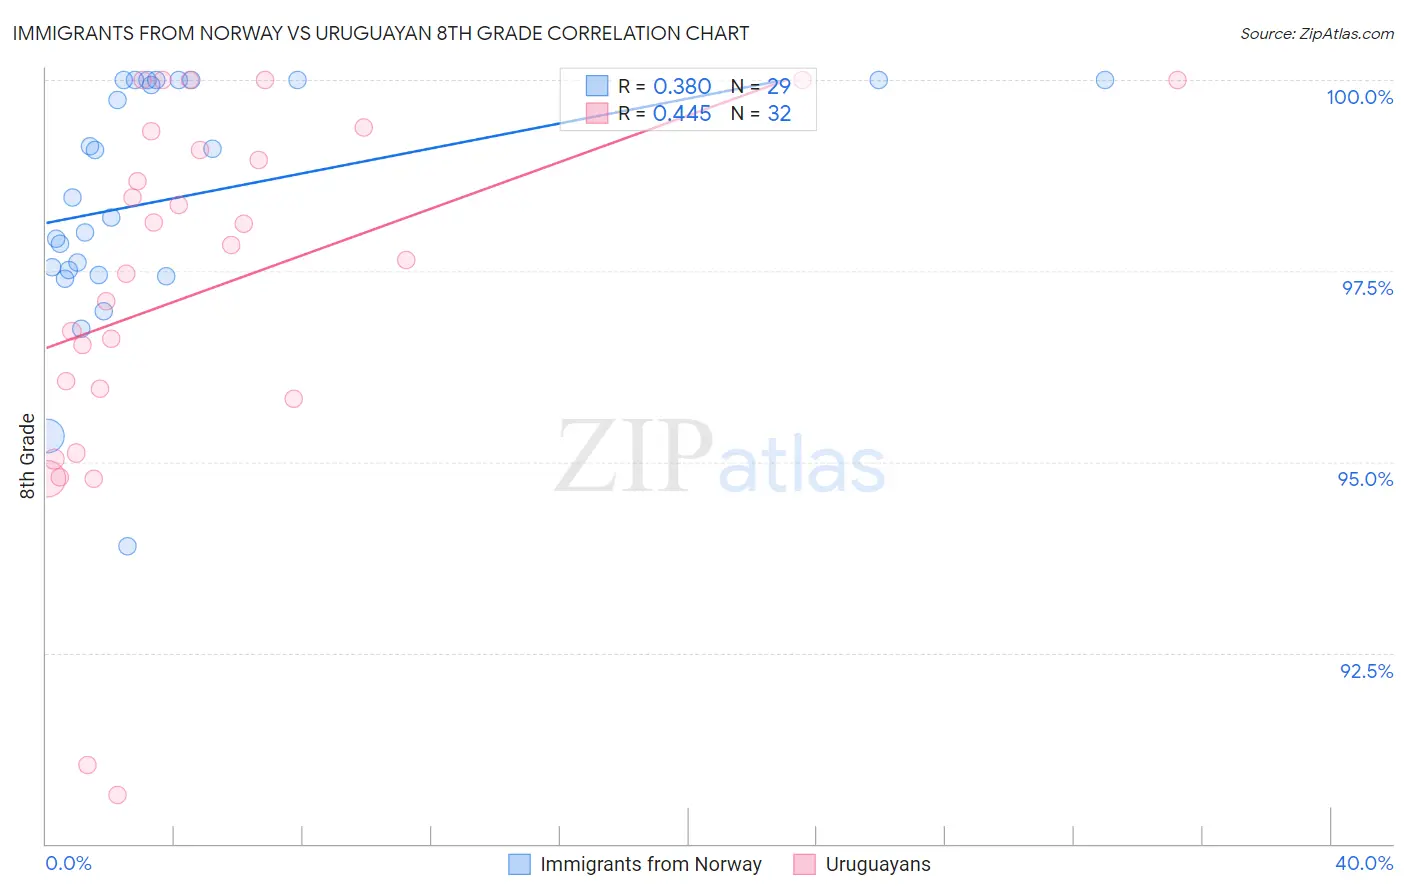
Immigrants from Norway vs Uruguayan 8th Grade Correlation Chart
The statistical analysis conducted on geographies consisting of 116,716,420 people shows a mild positive correlation between the proportion of Immigrants from Norway and percentage of population with at least 8th grade education in the United States with a correlation coefficient (R) of 0.380 and weighted average of 96.2%. Similarly, the statistical analysis conducted on geographies consisting of 144,782,794 people shows a moderate positive correlation between the proportion of Uruguayans and percentage of population with at least 8th grade education in the United States with a correlation coefficient (R) of 0.445 and weighted average of 95.1%, a difference of 1.2%.
8th Grade Correlation Summary
| Measurement | Immigrants from Norway | Uruguayan |
| Minimum | 93.9% | 90.6% |
| Maximum | 100.0% | 100.0% |
| Range | 6.1% | 9.4% |
| Mean | 98.5% | 97.3% |
| Median | 98.5% | 97.7% |
| Interquartile 25% (IQ1) | 97.5% | 95.9% |
| Interquartile 75% (IQ3) | 100.0% | 99.2% |
| Interquartile Range (IQR) | 2.5% | 3.3% |
| Standard Deviation (Sample) | 1.6% | 2.4% |
| Standard Deviation (Population) | 1.5% | 2.4% |
Similar Demographics by 8th Grade
Demographics Similar to Immigrants from Norway by 8th Grade
In terms of 8th grade, the demographic groups most similar to Immigrants from Norway are Nonimmigrants (96.2%, a difference of 0.010%), Immigrants from Croatia (96.2%, a difference of 0.010%), Immigrants from Switzerland (96.2%, a difference of 0.020%), Immigrants from France (96.2%, a difference of 0.020%), and Immigrants from Bulgaria (96.2%, a difference of 0.020%).
| Demographics | Rating | Rank | 8th Grade |
| Shoshone | 96.8 /100 | #111 | Exceptional 96.3% |
| Syrians | 96.7 /100 | #112 | Exceptional 96.3% |
| Immigrants | Zimbabwe | 96.7 /100 | #113 | Exceptional 96.3% |
| Immigrants | Japan | 96.5 /100 | #114 | Exceptional 96.2% |
| Immigrants | Moldova | 96.5 /100 | #115 | Exceptional 96.2% |
| Immigrants | Nonimmigrants | 96.0 /100 | #116 | Exceptional 96.2% |
| Immigrants | Croatia | 96.0 /100 | #117 | Exceptional 96.2% |
| Immigrants | Norway | 95.7 /100 | #118 | Exceptional 96.2% |
| Immigrants | Switzerland | 95.3 /100 | #119 | Exceptional 96.2% |
| Immigrants | France | 95.3 /100 | #120 | Exceptional 96.2% |
| Immigrants | Bulgaria | 95.3 /100 | #121 | Exceptional 96.2% |
| Immigrants | Europe | 95.3 /100 | #122 | Exceptional 96.2% |
| Filipinos | 94.6 /100 | #123 | Exceptional 96.2% |
| Palestinians | 94.6 /100 | #124 | Exceptional 96.2% |
| Immigrants | Romania | 94.1 /100 | #125 | Exceptional 96.2% |
Demographics Similar to Uruguayans by 8th Grade
In terms of 8th grade, the demographic groups most similar to Uruguayans are Immigrants from Senegal (95.1%, a difference of 0.010%), Jamaican (95.1%, a difference of 0.020%), Somali (95.1%, a difference of 0.020%), Immigrants from China (95.0%, a difference of 0.020%), and Korean (95.0%, a difference of 0.020%).
| Demographics | Rating | Rank | 8th Grade |
| South American Indians | 1.9 /100 | #241 | Tragic 95.1% |
| Tongans | 1.7 /100 | #242 | Tragic 95.1% |
| Paiute | 1.7 /100 | #243 | Tragic 95.1% |
| Immigrants | Middle Africa | 1.7 /100 | #244 | Tragic 95.1% |
| Jamaicans | 1.4 /100 | #245 | Tragic 95.1% |
| Somalis | 1.4 /100 | #246 | Tragic 95.1% |
| Immigrants | Senegal | 1.4 /100 | #247 | Tragic 95.1% |
| Uruguayans | 1.2 /100 | #248 | Tragic 95.1% |
| Immigrants | China | 1.1 /100 | #249 | Tragic 95.0% |
| Koreans | 1.1 /100 | #250 | Tragic 95.0% |
| Bolivians | 1.0 /100 | #251 | Tragic 95.0% |
| Immigrants | Ethiopia | 1.0 /100 | #252 | Tragic 95.0% |
| U.S. Virgin Islanders | 0.9 /100 | #253 | Tragic 95.0% |
| Immigrants | Cameroon | 0.8 /100 | #254 | Tragic 95.0% |
| Immigrants | Somalia | 0.7 /100 | #255 | Tragic 95.0% |