Immigrants from Norway vs Bulgarian Per Capita Income
COMPARE
Immigrants from Norway
Bulgarian
Per Capita Income
Per Capita Income Comparison
Immigrants from Norway
Bulgarians
$52,217
PER CAPITA INCOME
100.0/ 100
METRIC RATING
32nd/ 347
METRIC RANK
$50,906
PER CAPITA INCOME
100.0/ 100
METRIC RATING
47th/ 347
METRIC RANK
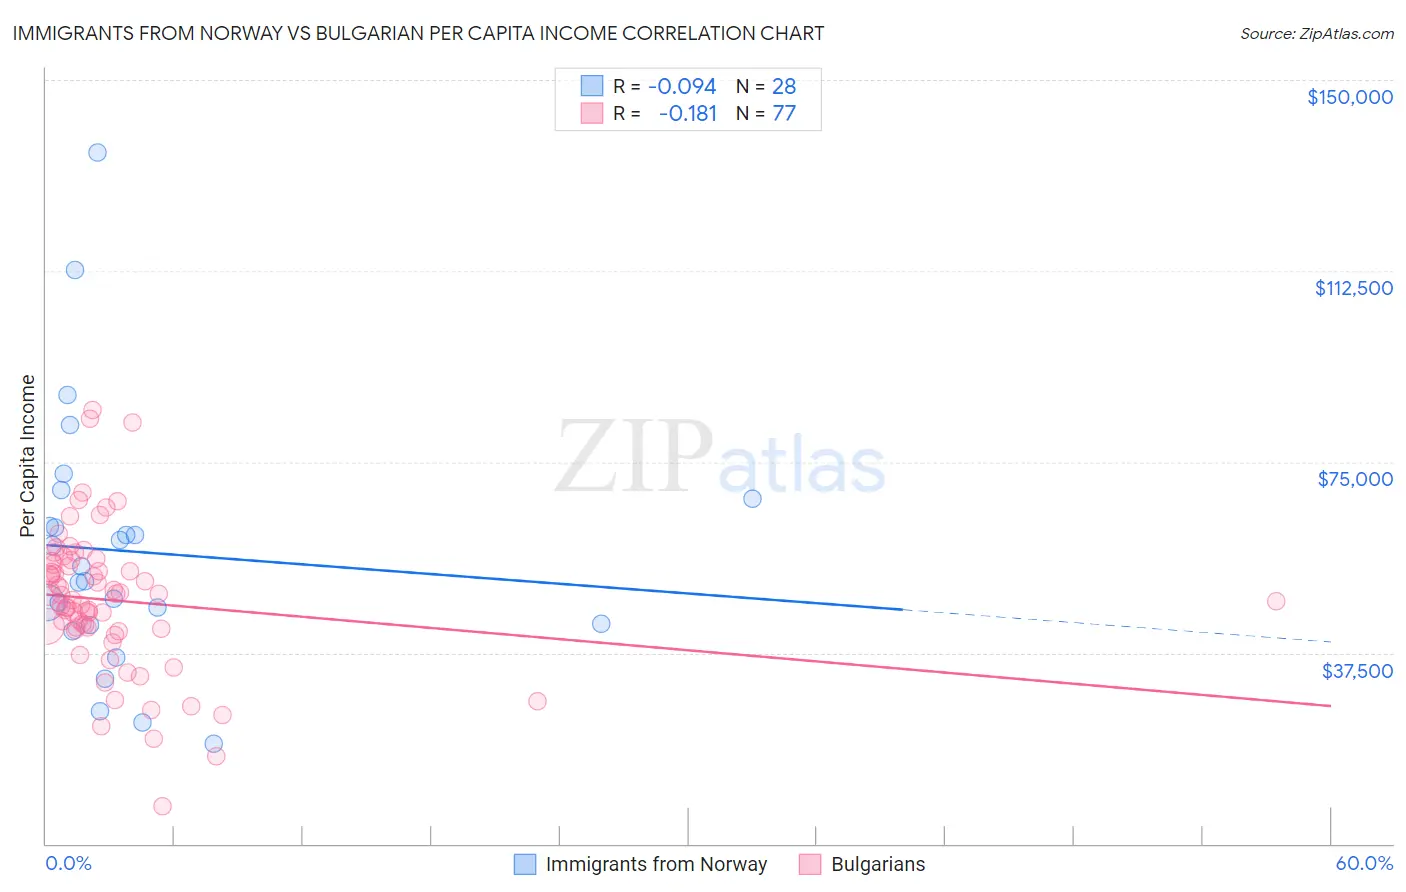
Immigrants from Norway vs Bulgarian Per Capita Income Correlation Chart
The statistical analysis conducted on geographies consisting of 116,714,031 people shows a slight negative correlation between the proportion of Immigrants from Norway and per capita income in the United States with a correlation coefficient (R) of -0.094 and weighted average of $52,217. Similarly, the statistical analysis conducted on geographies consisting of 205,631,200 people shows a poor negative correlation between the proportion of Bulgarians and per capita income in the United States with a correlation coefficient (R) of -0.181 and weighted average of $50,906, a difference of 2.6%.
Per Capita Income Correlation Summary
| Measurement | Immigrants from Norway | Bulgarian |
| Minimum | $19,734 | $7,295 |
| Maximum | $135,828 | $85,161 |
| Range | $116,094 | $77,866 |
| Mean | $57,343 | $47,737 |
| Median | $53,027 | $47,962 |
| Interquartile 25% (IQ1) | $43,092 | $42,061 |
| Interquartile 75% (IQ3) | $65,016 | $55,182 |
| Interquartile Range (IQR) | $21,924 | $13,122 |
| Standard Deviation (Sample) | $25,135 | $13,985 |
| Standard Deviation (Population) | $24,682 | $13,894 |
Demographics Similar to Immigrants from Norway and Bulgarians by Per Capita Income
In terms of per capita income, the demographic groups most similar to Immigrants from Norway are Australian ($52,074, a difference of 0.27%), Turkish ($52,391, a difference of 0.33%), Immigrants from Russia ($52,044, a difference of 0.33%), Burmese ($52,005, a difference of 0.41%), and Immigrants from Austria ($52,503, a difference of 0.55%). Similarly, the demographic groups most similar to Bulgarians are Immigrants from Latvia ($50,914, a difference of 0.020%), Immigrants from Spain ($50,933, a difference of 0.050%), Immigrants from Europe ($50,950, a difference of 0.090%), Immigrants from Serbia ($50,810, a difference of 0.19%), and New Zealander ($50,575, a difference of 0.65%).
| Demographics | Rating | Rank | Per Capita Income |
| Israelis | 100.0 /100 | #29 | Exceptional $52,596 |
| Immigrants | Austria | 100.0 /100 | #30 | Exceptional $52,503 |
| Turks | 100.0 /100 | #31 | Exceptional $52,391 |
| Immigrants | Norway | 100.0 /100 | #32 | Exceptional $52,217 |
| Australians | 100.0 /100 | #33 | Exceptional $52,074 |
| Immigrants | Russia | 100.0 /100 | #34 | Exceptional $52,044 |
| Burmese | 100.0 /100 | #35 | Exceptional $52,005 |
| Immigrants | Greece | 100.0 /100 | #36 | Exceptional $51,891 |
| Estonians | 100.0 /100 | #37 | Exceptional $51,875 |
| Immigrants | Czechoslovakia | 100.0 /100 | #38 | Exceptional $51,770 |
| Cambodians | 100.0 /100 | #39 | Exceptional $51,731 |
| Immigrants | Korea | 100.0 /100 | #40 | Exceptional $51,671 |
| Immigrants | South Africa | 100.0 /100 | #41 | Exceptional $51,465 |
| Immigrants | Turkey | 100.0 /100 | #42 | Exceptional $51,368 |
| Immigrants | Lithuania | 100.0 /100 | #43 | Exceptional $51,361 |
| Immigrants | Europe | 100.0 /100 | #44 | Exceptional $50,950 |
| Immigrants | Spain | 100.0 /100 | #45 | Exceptional $50,933 |
| Immigrants | Latvia | 100.0 /100 | #46 | Exceptional $50,914 |
| Bulgarians | 100.0 /100 | #47 | Exceptional $50,906 |
| Immigrants | Serbia | 100.0 /100 | #48 | Exceptional $50,810 |
| New Zealanders | 100.0 /100 | #49 | Exceptional $50,575 |