Immigrants from North Macedonia vs African Median Earnings
COMPARE
Immigrants from North Macedonia
African
Median Earnings
Median Earnings Comparison
Immigrants from North Macedonia
Africans
$49,658
MEDIAN EARNINGS
98.9/ 100
METRIC RATING
97th/ 347
METRIC RANK
$41,955
MEDIAN EARNINGS
0.2/ 100
METRIC RATING
282nd/ 347
METRIC RANK
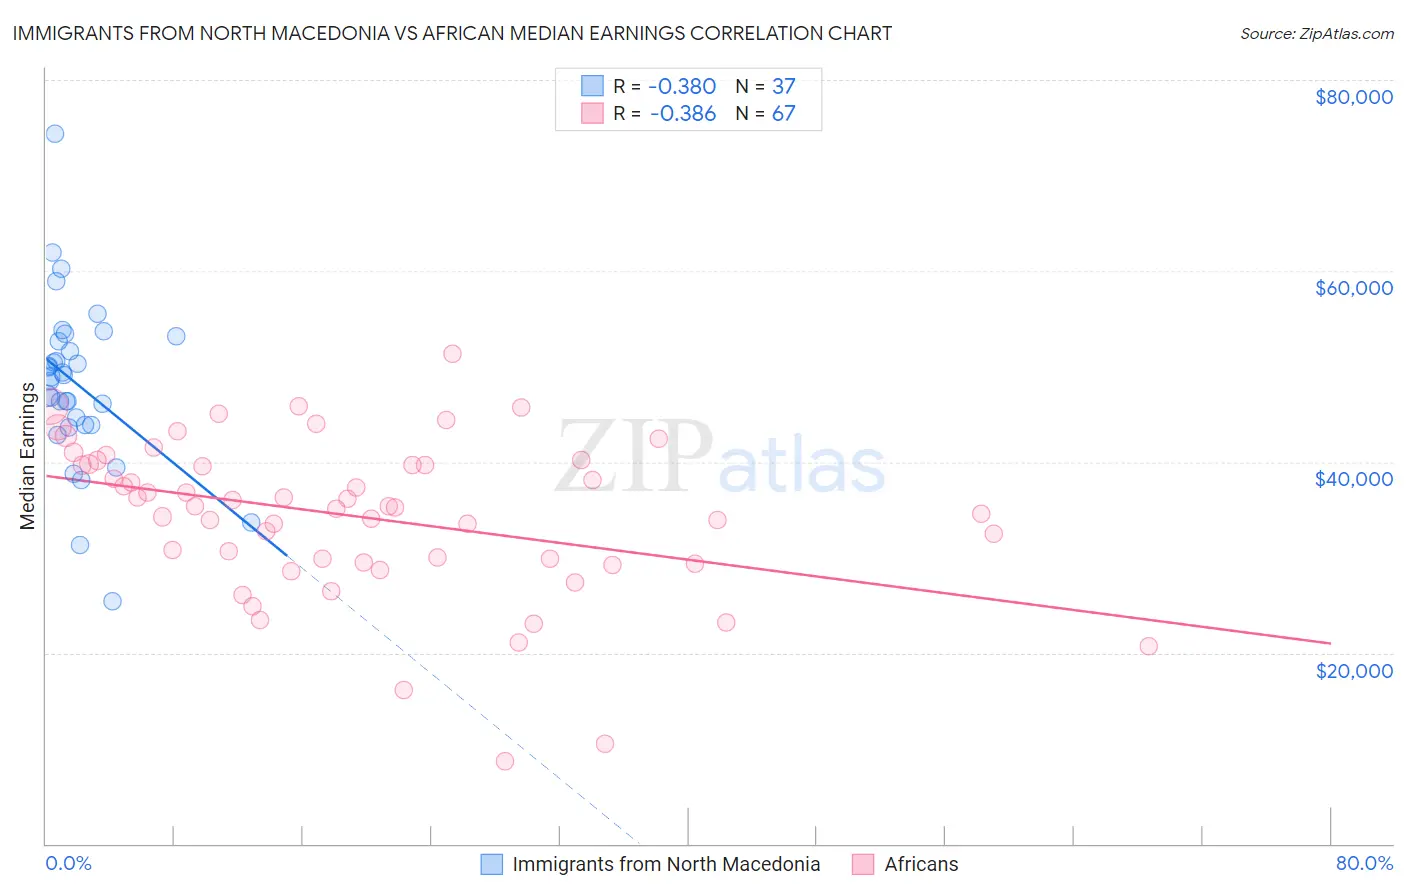
Immigrants from North Macedonia vs African Median Earnings Correlation Chart
The statistical analysis conducted on geographies consisting of 74,300,435 people shows a mild negative correlation between the proportion of Immigrants from North Macedonia and median earnings in the United States with a correlation coefficient (R) of -0.380 and weighted average of $49,658. Similarly, the statistical analysis conducted on geographies consisting of 470,066,359 people shows a mild negative correlation between the proportion of Africans and median earnings in the United States with a correlation coefficient (R) of -0.386 and weighted average of $41,955, a difference of 18.4%.
Median Earnings Correlation Summary
| Measurement | Immigrants from North Macedonia | African |
| Minimum | $25,438 | $8,672 |
| Maximum | $74,419 | $51,324 |
| Range | $48,981 | $42,652 |
| Mean | $48,126 | $34,249 |
| Median | $48,906 | $35,314 |
| Interquartile 25% (IQ1) | $43,904 | $29,519 |
| Interquartile 75% (IQ3) | $52,892 | $39,743 |
| Interquartile Range (IQR) | $8,988 | $10,224 |
| Standard Deviation (Sample) | $8,757 | $8,278 |
| Standard Deviation (Population) | $8,638 | $8,216 |
Similar Demographics by Median Earnings
Demographics Similar to Immigrants from North Macedonia by Median Earnings
In terms of median earnings, the demographic groups most similar to Immigrants from North Macedonia are Immigrants from Northern Africa ($49,648, a difference of 0.020%), Immigrants from Afghanistan ($49,645, a difference of 0.030%), Immigrants from Lebanon ($49,682, a difference of 0.050%), Immigrants from Poland ($49,633, a difference of 0.050%), and Jordanian ($49,632, a difference of 0.050%).
| Demographics | Rating | Rank | Median Earnings |
| Italians | 99.3 /100 | #90 | Exceptional $49,915 |
| Macedonians | 99.2 /100 | #91 | Exceptional $49,893 |
| Immigrants | Argentina | 99.2 /100 | #92 | Exceptional $49,841 |
| Armenians | 99.1 /100 | #93 | Exceptional $49,804 |
| Croatians | 99.0 /100 | #94 | Exceptional $49,724 |
| Immigrants | England | 99.0 /100 | #95 | Exceptional $49,722 |
| Immigrants | Lebanon | 99.0 /100 | #96 | Exceptional $49,682 |
| Immigrants | North Macedonia | 98.9 /100 | #97 | Exceptional $49,658 |
| Immigrants | Northern Africa | 98.9 /100 | #98 | Exceptional $49,648 |
| Immigrants | Afghanistan | 98.9 /100 | #99 | Exceptional $49,645 |
| Immigrants | Poland | 98.9 /100 | #100 | Exceptional $49,633 |
| Jordanians | 98.9 /100 | #101 | Exceptional $49,632 |
| Ethiopians | 98.8 /100 | #102 | Exceptional $49,572 |
| Austrians | 98.7 /100 | #103 | Exceptional $49,501 |
| Immigrants | Brazil | 98.6 /100 | #104 | Exceptional $49,463 |
Demographics Similar to Africans by Median Earnings
In terms of median earnings, the demographic groups most similar to Africans are Marshallese ($41,969, a difference of 0.030%), Dominican ($41,864, a difference of 0.22%), Blackfeet ($41,822, a difference of 0.32%), Hmong ($42,111, a difference of 0.37%), and Colville ($42,151, a difference of 0.47%).
| Demographics | Rating | Rank | Median Earnings |
| Immigrants | Belize | 0.3 /100 | #275 | Tragic $42,339 |
| Spanish Americans | 0.3 /100 | #276 | Tragic $42,316 |
| Central Americans | 0.3 /100 | #277 | Tragic $42,280 |
| Cajuns | 0.3 /100 | #278 | Tragic $42,189 |
| Colville | 0.2 /100 | #279 | Tragic $42,151 |
| Hmong | 0.2 /100 | #280 | Tragic $42,111 |
| Marshallese | 0.2 /100 | #281 | Tragic $41,969 |
| Africans | 0.2 /100 | #282 | Tragic $41,955 |
| Dominicans | 0.2 /100 | #283 | Tragic $41,864 |
| Blackfeet | 0.2 /100 | #284 | Tragic $41,822 |
| Immigrants | Nicaragua | 0.1 /100 | #285 | Tragic $41,737 |
| Mexican American Indians | 0.1 /100 | #286 | Tragic $41,719 |
| Indonesians | 0.1 /100 | #287 | Tragic $41,701 |
| Immigrants | Dominican Republic | 0.1 /100 | #288 | Tragic $41,554 |
| Comanche | 0.1 /100 | #289 | Tragic $41,519 |