Immigrants from North Macedonia vs Romanian Median Earnings
COMPARE
Immigrants from North Macedonia
Romanian
Median Earnings
Median Earnings Comparison
Immigrants from North Macedonia
Romanians
$49,658
MEDIAN EARNINGS
98.9/ 100
METRIC RATING
97th/ 347
METRIC RANK
$50,244
MEDIAN EARNINGS
99.5/ 100
METRIC RATING
83rd/ 347
METRIC RANK
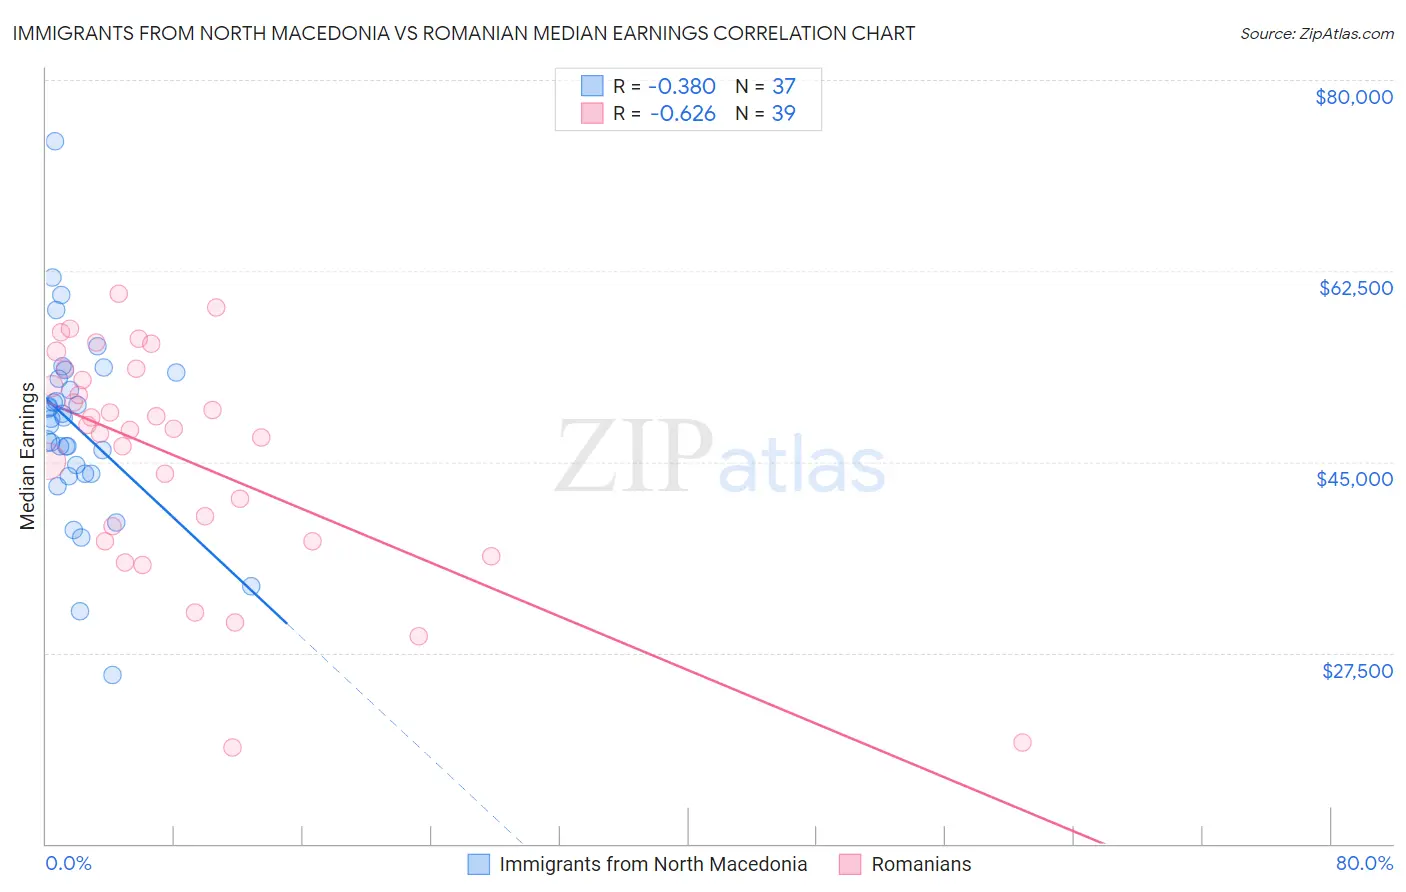
Immigrants from North Macedonia vs Romanian Median Earnings Correlation Chart
The statistical analysis conducted on geographies consisting of 74,300,435 people shows a mild negative correlation between the proportion of Immigrants from North Macedonia and median earnings in the United States with a correlation coefficient (R) of -0.380 and weighted average of $49,658. Similarly, the statistical analysis conducted on geographies consisting of 377,906,078 people shows a significant negative correlation between the proportion of Romanians and median earnings in the United States with a correlation coefficient (R) of -0.626 and weighted average of $50,244, a difference of 1.2%.
Median Earnings Correlation Summary
| Measurement | Immigrants from North Macedonia | Romanian |
| Minimum | $25,438 | $18,814 |
| Maximum | $74,419 | $60,367 |
| Range | $48,981 | $41,553 |
| Mean | $48,126 | $45,500 |
| Median | $48,906 | $48,068 |
| Interquartile 25% (IQ1) | $43,904 | $37,750 |
| Interquartile 75% (IQ3) | $52,892 | $53,505 |
| Interquartile Range (IQR) | $8,988 | $15,755 |
| Standard Deviation (Sample) | $8,757 | $10,336 |
| Standard Deviation (Population) | $8,638 | $10,203 |
Demographics Similar to Immigrants from North Macedonia and Romanians by Median Earnings
In terms of median earnings, the demographic groups most similar to Immigrants from North Macedonia are Immigrants from Northern Africa ($49,648, a difference of 0.020%), Immigrants from Afghanistan ($49,645, a difference of 0.030%), Immigrants from Lebanon ($49,682, a difference of 0.050%), Immigrants from Poland ($49,633, a difference of 0.050%), and Croatian ($49,724, a difference of 0.13%). Similarly, the demographic groups most similar to Romanians are Immigrants from Hungary ($50,227, a difference of 0.030%), Immigrants from Kazakhstan ($50,225, a difference of 0.040%), Immigrants from Moldova ($50,274, a difference of 0.060%), Immigrants from Southern Europe ($50,280, a difference of 0.070%), and Immigrants from Canada ($50,192, a difference of 0.10%).
| Demographics | Rating | Rank | Median Earnings |
| Ukrainians | 99.6 /100 | #80 | Exceptional $50,320 |
| Immigrants | Southern Europe | 99.6 /100 | #81 | Exceptional $50,280 |
| Immigrants | Moldova | 99.5 /100 | #82 | Exceptional $50,274 |
| Romanians | 99.5 /100 | #83 | Exceptional $50,244 |
| Immigrants | Hungary | 99.5 /100 | #84 | Exceptional $50,227 |
| Immigrants | Kazakhstan | 99.5 /100 | #85 | Exceptional $50,225 |
| Immigrants | Canada | 99.5 /100 | #86 | Exceptional $50,192 |
| Immigrants | Uzbekistan | 99.5 /100 | #87 | Exceptional $50,151 |
| Albanians | 99.4 /100 | #88 | Exceptional $50,116 |
| Immigrants | North America | 99.4 /100 | #89 | Exceptional $50,108 |
| Italians | 99.3 /100 | #90 | Exceptional $49,915 |
| Macedonians | 99.2 /100 | #91 | Exceptional $49,893 |
| Immigrants | Argentina | 99.2 /100 | #92 | Exceptional $49,841 |
| Armenians | 99.1 /100 | #93 | Exceptional $49,804 |
| Croatians | 99.0 /100 | #94 | Exceptional $49,724 |
| Immigrants | England | 99.0 /100 | #95 | Exceptional $49,722 |
| Immigrants | Lebanon | 99.0 /100 | #96 | Exceptional $49,682 |
| Immigrants | North Macedonia | 98.9 /100 | #97 | Exceptional $49,658 |
| Immigrants | Northern Africa | 98.9 /100 | #98 | Exceptional $49,648 |
| Immigrants | Afghanistan | 98.9 /100 | #99 | Exceptional $49,645 |
| Immigrants | Poland | 98.9 /100 | #100 | Exceptional $49,633 |