Immigrants from North Macedonia vs Sudanese Householder Income Ages 25 - 44 years
COMPARE
Immigrants from North Macedonia
Sudanese
Householder Income Ages 25 - 44 years
Householder Income Ages 25 - 44 years Comparison
Immigrants from North Macedonia
Sudanese
$100,101
HOUSEHOLDER INCOME AGES 25 - 44 YEARS
95.6/ 100
METRIC RATING
109th/ 347
METRIC RANK
$84,401
HOUSEHOLDER INCOME AGES 25 - 44 YEARS
0.4/ 100
METRIC RATING
265th/ 347
METRIC RANK
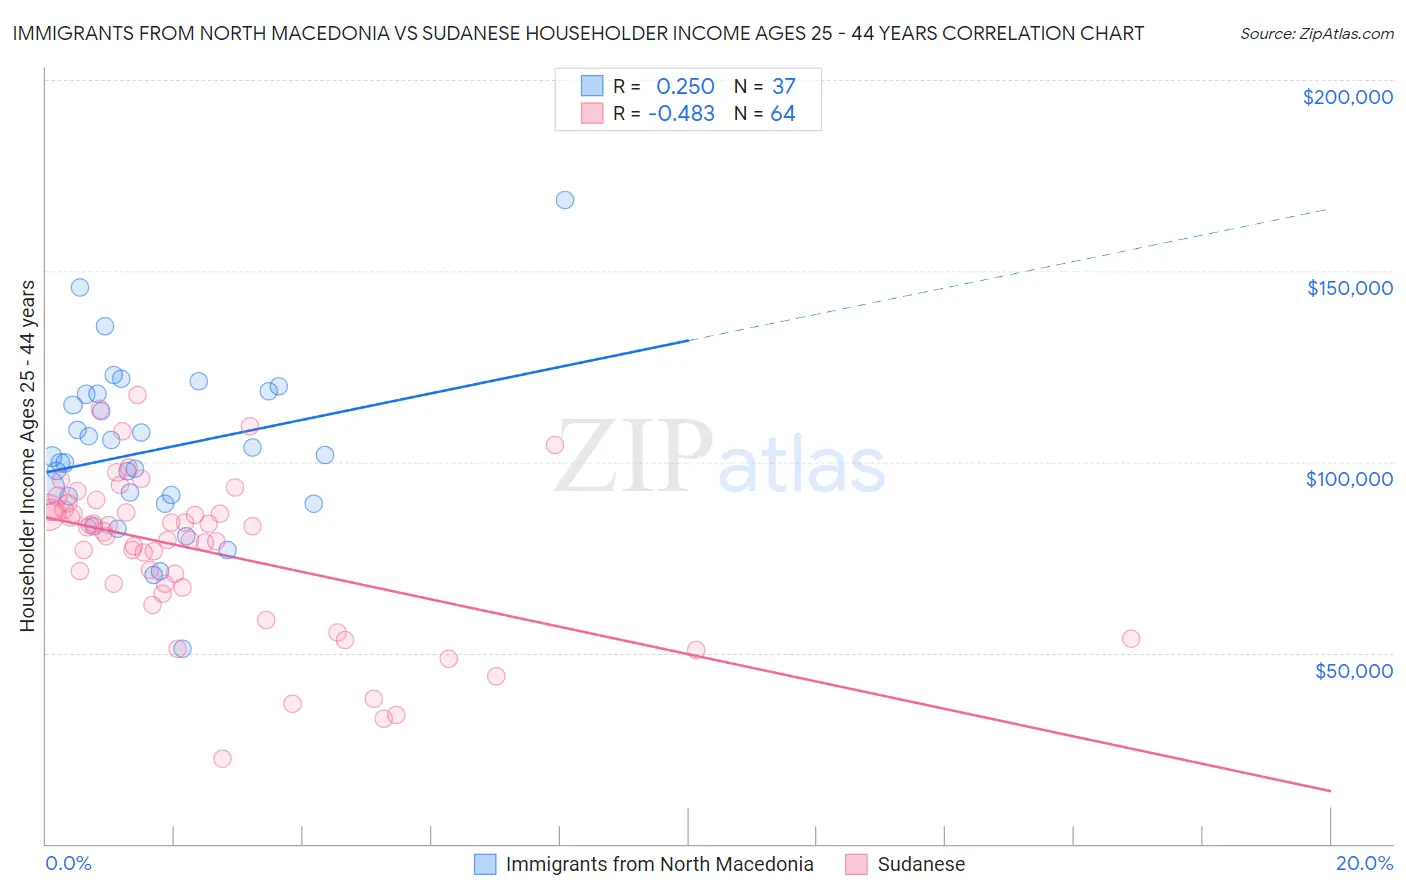
Immigrants from North Macedonia vs Sudanese Householder Income Ages 25 - 44 years Correlation Chart
The statistical analysis conducted on geographies consisting of 74,266,818 people shows a weak positive correlation between the proportion of Immigrants from North Macedonia and household income with householder between the ages 25 and 44 in the United States with a correlation coefficient (R) of 0.250 and weighted average of $100,101. Similarly, the statistical analysis conducted on geographies consisting of 110,044,809 people shows a moderate negative correlation between the proportion of Sudanese and household income with householder between the ages 25 and 44 in the United States with a correlation coefficient (R) of -0.483 and weighted average of $84,401, a difference of 18.6%.
Householder Income Ages 25 - 44 years Correlation Summary
| Measurement | Immigrants from North Macedonia | Sudanese |
| Minimum | $51,151 | $22,303 |
| Maximum | $168,534 | $117,632 |
| Range | $117,383 | $95,330 |
| Mean | $102,890 | $76,942 |
| Median | $101,325 | $82,204 |
| Interquartile 25% (IQ1) | $89,993 | $67,535 |
| Interquartile 75% (IQ3) | $117,844 | $87,340 |
| Interquartile Range (IQR) | $27,851 | $19,805 |
| Standard Deviation (Sample) | $21,872 | $20,185 |
| Standard Deviation (Population) | $21,575 | $20,027 |
Similar Demographics by Householder Income Ages 25 - 44 years
Demographics Similar to Immigrants from North Macedonia by Householder Income Ages 25 - 44 years
In terms of householder income ages 25 - 44 years, the demographic groups most similar to Immigrants from North Macedonia are Immigrants from Afghanistan ($99,977, a difference of 0.12%), Immigrants from South Eastern Asia ($100,283, a difference of 0.18%), Chilean ($99,900, a difference of 0.20%), Northern European ($100,457, a difference of 0.36%), and Polish ($99,685, a difference of 0.42%).
| Demographics | Rating | Rank | Householder Income Ages 25 - 44 years |
| Immigrants | Lebanon | 97.4 /100 | #102 | Exceptional $101,124 |
| Immigrants | Moldova | 97.4 /100 | #103 | Exceptional $101,091 |
| Immigrants | Poland | 97.4 /100 | #104 | Exceptional $101,065 |
| Immigrants | Vietnam | 96.5 /100 | #105 | Exceptional $100,535 |
| Immigrants | Brazil | 96.5 /100 | #106 | Exceptional $100,534 |
| Northern Europeans | 96.3 /100 | #107 | Exceptional $100,457 |
| Immigrants | South Eastern Asia | 96.0 /100 | #108 | Exceptional $100,283 |
| Immigrants | North Macedonia | 95.6 /100 | #109 | Exceptional $100,101 |
| Immigrants | Afghanistan | 95.3 /100 | #110 | Exceptional $99,977 |
| Chileans | 95.1 /100 | #111 | Exceptional $99,900 |
| Poles | 94.5 /100 | #112 | Exceptional $99,685 |
| Tongans | 94.2 /100 | #113 | Exceptional $99,604 |
| Immigrants | Western Asia | 94.0 /100 | #114 | Exceptional $99,516 |
| Carpatho Rusyns | 93.7 /100 | #115 | Exceptional $99,449 |
| Portuguese | 93.7 /100 | #116 | Exceptional $99,429 |
Demographics Similar to Sudanese by Householder Income Ages 25 - 44 years
In terms of householder income ages 25 - 44 years, the demographic groups most similar to Sudanese are Osage ($84,461, a difference of 0.070%), Immigrants from Cabo Verde ($84,304, a difference of 0.12%), Belizean ($84,534, a difference of 0.16%), Hmong ($84,258, a difference of 0.17%), and Cree ($84,574, a difference of 0.20%).
| Demographics | Rating | Rank | Householder Income Ages 25 - 44 years |
| Immigrants | Nicaragua | 0.5 /100 | #258 | Tragic $84,914 |
| Immigrants | Senegal | 0.5 /100 | #259 | Tragic $84,848 |
| Americans | 0.4 /100 | #260 | Tragic $84,791 |
| Inupiat | 0.4 /100 | #261 | Tragic $84,619 |
| Cree | 0.4 /100 | #262 | Tragic $84,574 |
| Belizeans | 0.4 /100 | #263 | Tragic $84,534 |
| Osage | 0.4 /100 | #264 | Tragic $84,461 |
| Sudanese | 0.4 /100 | #265 | Tragic $84,401 |
| Immigrants | Cabo Verde | 0.3 /100 | #266 | Tragic $84,304 |
| Hmong | 0.3 /100 | #267 | Tragic $84,258 |
| Sub-Saharan Africans | 0.3 /100 | #268 | Tragic $84,235 |
| Spanish American Indians | 0.3 /100 | #269 | Tragic $84,085 |
| Jamaicans | 0.3 /100 | #270 | Tragic $83,933 |
| Somalis | 0.2 /100 | #271 | Tragic $83,752 |
| Spanish Americans | 0.2 /100 | #272 | Tragic $83,722 |