Immigrants from North Macedonia vs Sierra Leonean Median Earnings
COMPARE
Immigrants from North Macedonia
Sierra Leonean
Median Earnings
Median Earnings Comparison
Immigrants from North Macedonia
Sierra Leoneans
$49,658
MEDIAN EARNINGS
98.9/ 100
METRIC RATING
97th/ 347
METRIC RANK
$48,286
MEDIAN EARNINGS
93.1/ 100
METRIC RATING
127th/ 347
METRIC RANK
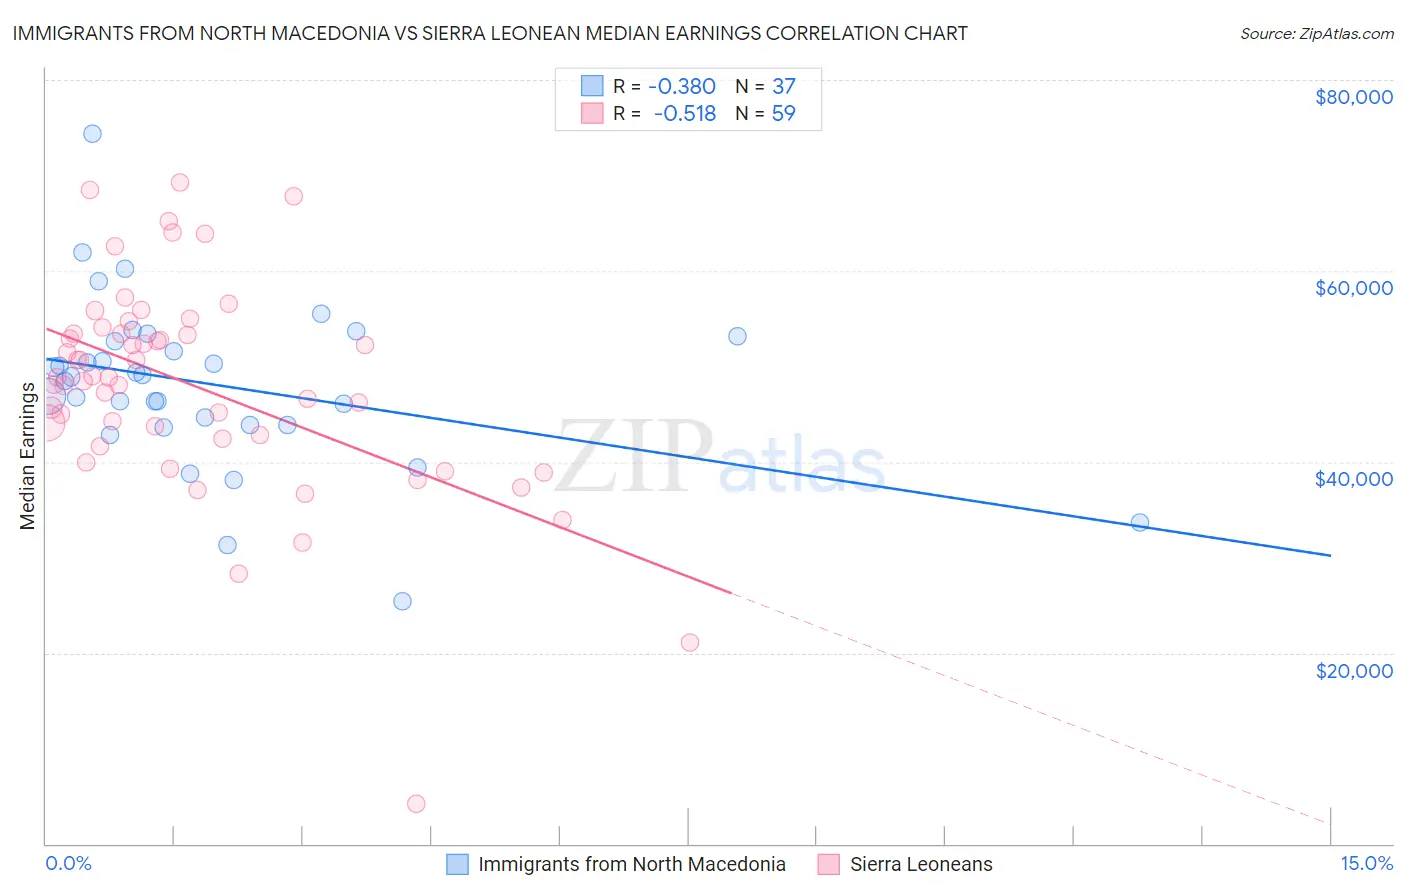
Immigrants from North Macedonia vs Sierra Leonean Median Earnings Correlation Chart
The statistical analysis conducted on geographies consisting of 74,300,435 people shows a mild negative correlation between the proportion of Immigrants from North Macedonia and median earnings in the United States with a correlation coefficient (R) of -0.380 and weighted average of $49,658. Similarly, the statistical analysis conducted on geographies consisting of 83,350,653 people shows a substantial negative correlation between the proportion of Sierra Leoneans and median earnings in the United States with a correlation coefficient (R) of -0.518 and weighted average of $48,286, a difference of 2.8%.
Median Earnings Correlation Summary
| Measurement | Immigrants from North Macedonia | Sierra Leonean |
| Minimum | $25,438 | $4,235 |
| Maximum | $74,419 | $69,241 |
| Range | $48,981 | $65,006 |
| Mean | $48,126 | $47,947 |
| Median | $48,906 | $48,865 |
| Interquartile 25% (IQ1) | $43,904 | $42,439 |
| Interquartile 75% (IQ3) | $52,892 | $53,466 |
| Interquartile Range (IQR) | $8,988 | $11,027 |
| Standard Deviation (Sample) | $8,757 | $11,282 |
| Standard Deviation (Population) | $8,638 | $11,186 |
Similar Demographics by Median Earnings
Demographics Similar to Immigrants from North Macedonia by Median Earnings
In terms of median earnings, the demographic groups most similar to Immigrants from North Macedonia are Immigrants from Northern Africa ($49,648, a difference of 0.020%), Immigrants from Afghanistan ($49,645, a difference of 0.030%), Immigrants from Lebanon ($49,682, a difference of 0.050%), Immigrants from Poland ($49,633, a difference of 0.050%), and Jordanian ($49,632, a difference of 0.050%).
| Demographics | Rating | Rank | Median Earnings |
| Italians | 99.3 /100 | #90 | Exceptional $49,915 |
| Macedonians | 99.2 /100 | #91 | Exceptional $49,893 |
| Immigrants | Argentina | 99.2 /100 | #92 | Exceptional $49,841 |
| Armenians | 99.1 /100 | #93 | Exceptional $49,804 |
| Croatians | 99.0 /100 | #94 | Exceptional $49,724 |
| Immigrants | England | 99.0 /100 | #95 | Exceptional $49,722 |
| Immigrants | Lebanon | 99.0 /100 | #96 | Exceptional $49,682 |
| Immigrants | North Macedonia | 98.9 /100 | #97 | Exceptional $49,658 |
| Immigrants | Northern Africa | 98.9 /100 | #98 | Exceptional $49,648 |
| Immigrants | Afghanistan | 98.9 /100 | #99 | Exceptional $49,645 |
| Immigrants | Poland | 98.9 /100 | #100 | Exceptional $49,633 |
| Jordanians | 98.9 /100 | #101 | Exceptional $49,632 |
| Ethiopians | 98.8 /100 | #102 | Exceptional $49,572 |
| Austrians | 98.7 /100 | #103 | Exceptional $49,501 |
| Immigrants | Brazil | 98.6 /100 | #104 | Exceptional $49,463 |
Demographics Similar to Sierra Leoneans by Median Earnings
In terms of median earnings, the demographic groups most similar to Sierra Leoneans are Immigrants from Fiji ($48,305, a difference of 0.040%), Assyrian/Chaldean/Syriac ($48,304, a difference of 0.040%), Immigrants from Philippines ($48,266, a difference of 0.040%), Pakistani ($48,254, a difference of 0.070%), and Zimbabwean ($48,229, a difference of 0.12%).
| Demographics | Rating | Rank | Median Earnings |
| Carpatho Rusyns | 95.5 /100 | #120 | Exceptional $48,617 |
| Arabs | 95.4 /100 | #121 | Exceptional $48,599 |
| Chileans | 94.8 /100 | #122 | Exceptional $48,504 |
| Immigrants | Syria | 93.9 /100 | #123 | Exceptional $48,375 |
| Brazilians | 93.7 /100 | #124 | Exceptional $48,356 |
| Immigrants | Fiji | 93.3 /100 | #125 | Exceptional $48,305 |
| Assyrians/Chaldeans/Syriacs | 93.3 /100 | #126 | Exceptional $48,304 |
| Sierra Leoneans | 93.1 /100 | #127 | Exceptional $48,286 |
| Immigrants | Philippines | 92.9 /100 | #128 | Exceptional $48,266 |
| Pakistanis | 92.8 /100 | #129 | Exceptional $48,254 |
| Zimbabweans | 92.6 /100 | #130 | Exceptional $48,229 |
| Lebanese | 92.5 /100 | #131 | Exceptional $48,226 |
| British | 92.2 /100 | #132 | Exceptional $48,189 |
| Immigrants | Uganda | 90.5 /100 | #133 | Exceptional $48,041 |
| Sri Lankans | 90.5 /100 | #134 | Exceptional $48,040 |