Immigrants from North America vs Malaysian Median Earnings
COMPARE
Immigrants from North America
Malaysian
Median Earnings
Median Earnings Comparison
Immigrants from North America
Malaysians
$50,108
MEDIAN EARNINGS
99.4/ 100
METRIC RATING
89th/ 347
METRIC RANK
$43,844
MEDIAN EARNINGS
2.6/ 100
METRIC RATING
249th/ 347
METRIC RANK
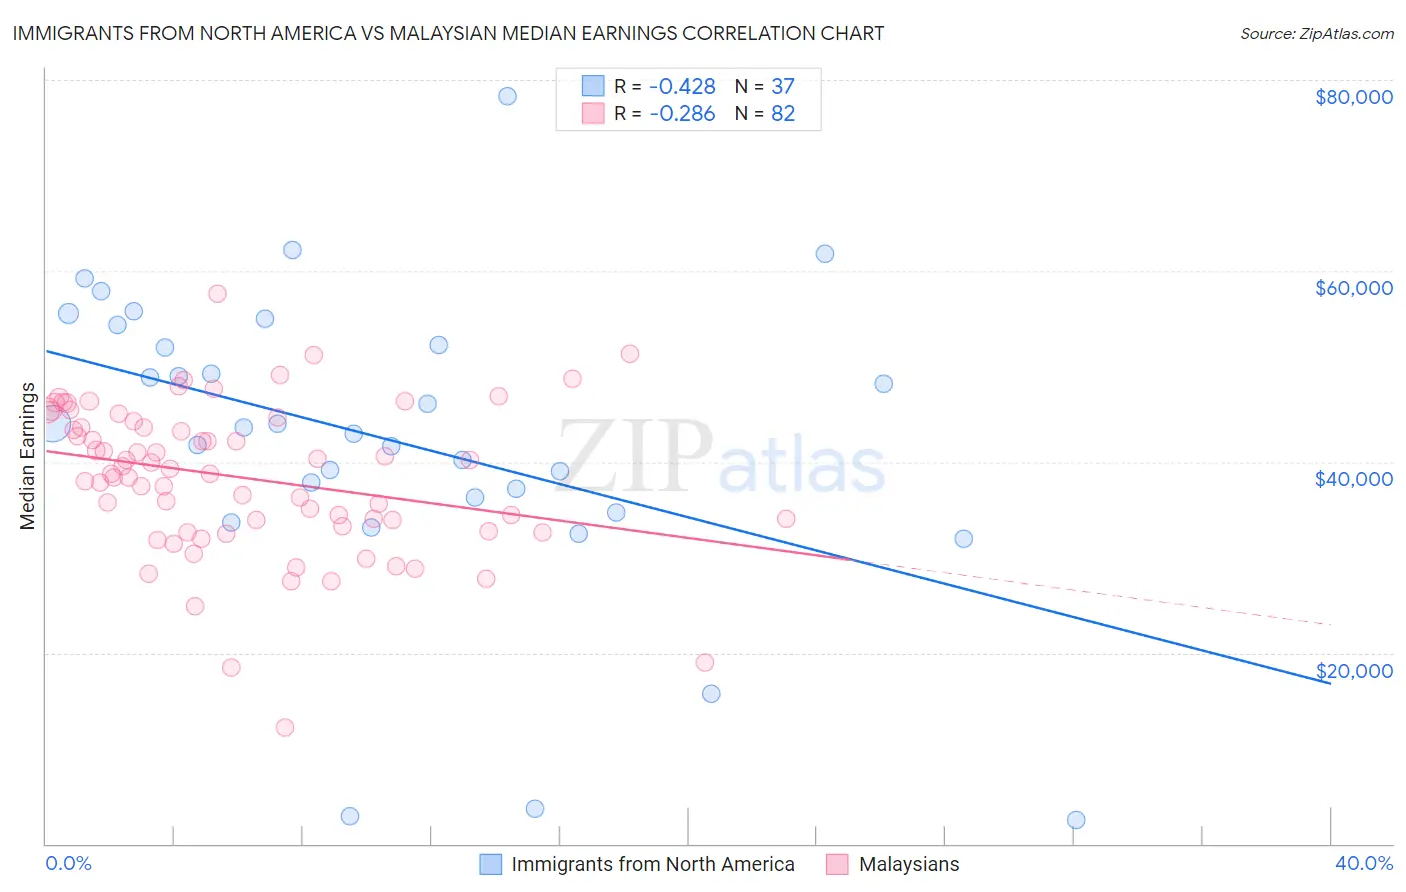
Immigrants from North America vs Malaysian Median Earnings Correlation Chart
The statistical analysis conducted on geographies consisting of 462,391,423 people shows a moderate negative correlation between the proportion of Immigrants from North America and median earnings in the United States with a correlation coefficient (R) of -0.428 and weighted average of $50,108. Similarly, the statistical analysis conducted on geographies consisting of 226,109,286 people shows a weak negative correlation between the proportion of Malaysians and median earnings in the United States with a correlation coefficient (R) of -0.286 and weighted average of $43,844, a difference of 14.3%.
Median Earnings Correlation Summary
| Measurement | Immigrants from North America | Malaysian |
| Minimum | $2,499 | $12,196 |
| Maximum | $78,310 | $57,662 |
| Range | $75,811 | $45,466 |
| Mean | $42,268 | $38,334 |
| Median | $43,536 | $39,047 |
| Interquartile 25% (IQ1) | $35,442 | $33,295 |
| Interquartile 75% (IQ3) | $53,269 | $44,277 |
| Interquartile Range (IQR) | $17,827 | $10,982 |
| Standard Deviation (Sample) | $16,254 | $7,931 |
| Standard Deviation (Population) | $16,033 | $7,883 |
Similar Demographics by Median Earnings
Demographics Similar to Immigrants from North America by Median Earnings
In terms of median earnings, the demographic groups most similar to Immigrants from North America are Albanian ($50,116, a difference of 0.020%), Immigrants from Uzbekistan ($50,151, a difference of 0.090%), Immigrants from Canada ($50,192, a difference of 0.17%), Immigrants from Kazakhstan ($50,225, a difference of 0.23%), and Immigrants from Hungary ($50,227, a difference of 0.24%).
| Demographics | Rating | Rank | Median Earnings |
| Immigrants | Moldova | 99.5 /100 | #82 | Exceptional $50,274 |
| Romanians | 99.5 /100 | #83 | Exceptional $50,244 |
| Immigrants | Hungary | 99.5 /100 | #84 | Exceptional $50,227 |
| Immigrants | Kazakhstan | 99.5 /100 | #85 | Exceptional $50,225 |
| Immigrants | Canada | 99.5 /100 | #86 | Exceptional $50,192 |
| Immigrants | Uzbekistan | 99.5 /100 | #87 | Exceptional $50,151 |
| Albanians | 99.4 /100 | #88 | Exceptional $50,116 |
| Immigrants | North America | 99.4 /100 | #89 | Exceptional $50,108 |
| Italians | 99.3 /100 | #90 | Exceptional $49,915 |
| Macedonians | 99.2 /100 | #91 | Exceptional $49,893 |
| Immigrants | Argentina | 99.2 /100 | #92 | Exceptional $49,841 |
| Armenians | 99.1 /100 | #93 | Exceptional $49,804 |
| Croatians | 99.0 /100 | #94 | Exceptional $49,724 |
| Immigrants | England | 99.0 /100 | #95 | Exceptional $49,722 |
| Immigrants | Lebanon | 99.0 /100 | #96 | Exceptional $49,682 |
Demographics Similar to Malaysians by Median Earnings
In terms of median earnings, the demographic groups most similar to Malaysians are Nepalese ($43,860, a difference of 0.040%), Alaska Native ($43,750, a difference of 0.22%), Immigrants from Cabo Verde ($43,963, a difference of 0.27%), Immigrants from West Indies ($43,989, a difference of 0.33%), and Tsimshian ($43,695, a difference of 0.34%).
| Demographics | Rating | Rank | Median Earnings |
| Immigrants | Venezuela | 4.0 /100 | #242 | Tragic $44,163 |
| Sub-Saharan Africans | 3.7 /100 | #243 | Tragic $44,118 |
| Immigrants | Nonimmigrants | 3.7 /100 | #244 | Tragic $44,117 |
| Immigrants | Burma/Myanmar | 3.2 /100 | #245 | Tragic $43,998 |
| Immigrants | West Indies | 3.1 /100 | #246 | Tragic $43,989 |
| Immigrants | Cabo Verde | 3.0 /100 | #247 | Tragic $43,963 |
| Nepalese | 2.6 /100 | #248 | Tragic $43,860 |
| Malaysians | 2.6 /100 | #249 | Tragic $43,844 |
| Alaska Natives | 2.3 /100 | #250 | Tragic $43,750 |
| Tsimshian | 2.1 /100 | #251 | Tragic $43,695 |
| Hawaiians | 2.0 /100 | #252 | Tragic $43,673 |
| Somalis | 1.8 /100 | #253 | Tragic $43,567 |
| Liberians | 1.7 /100 | #254 | Tragic $43,536 |
| Immigrants | Middle Africa | 1.4 /100 | #255 | Tragic $43,416 |
| Alaskan Athabascans | 1.4 /100 | #256 | Tragic $43,393 |