Immigrants from Morocco vs Haitian 1st Grade
COMPARE
Immigrants from Morocco
Haitian
1st Grade
1st Grade Comparison
Immigrants from Morocco
Haitians
97.7%
1ST GRADE
5.3/ 100
METRIC RATING
218th/ 347
METRIC RANK
97.1%
1ST GRADE
0.0/ 100
METRIC RATING
300th/ 347
METRIC RANK
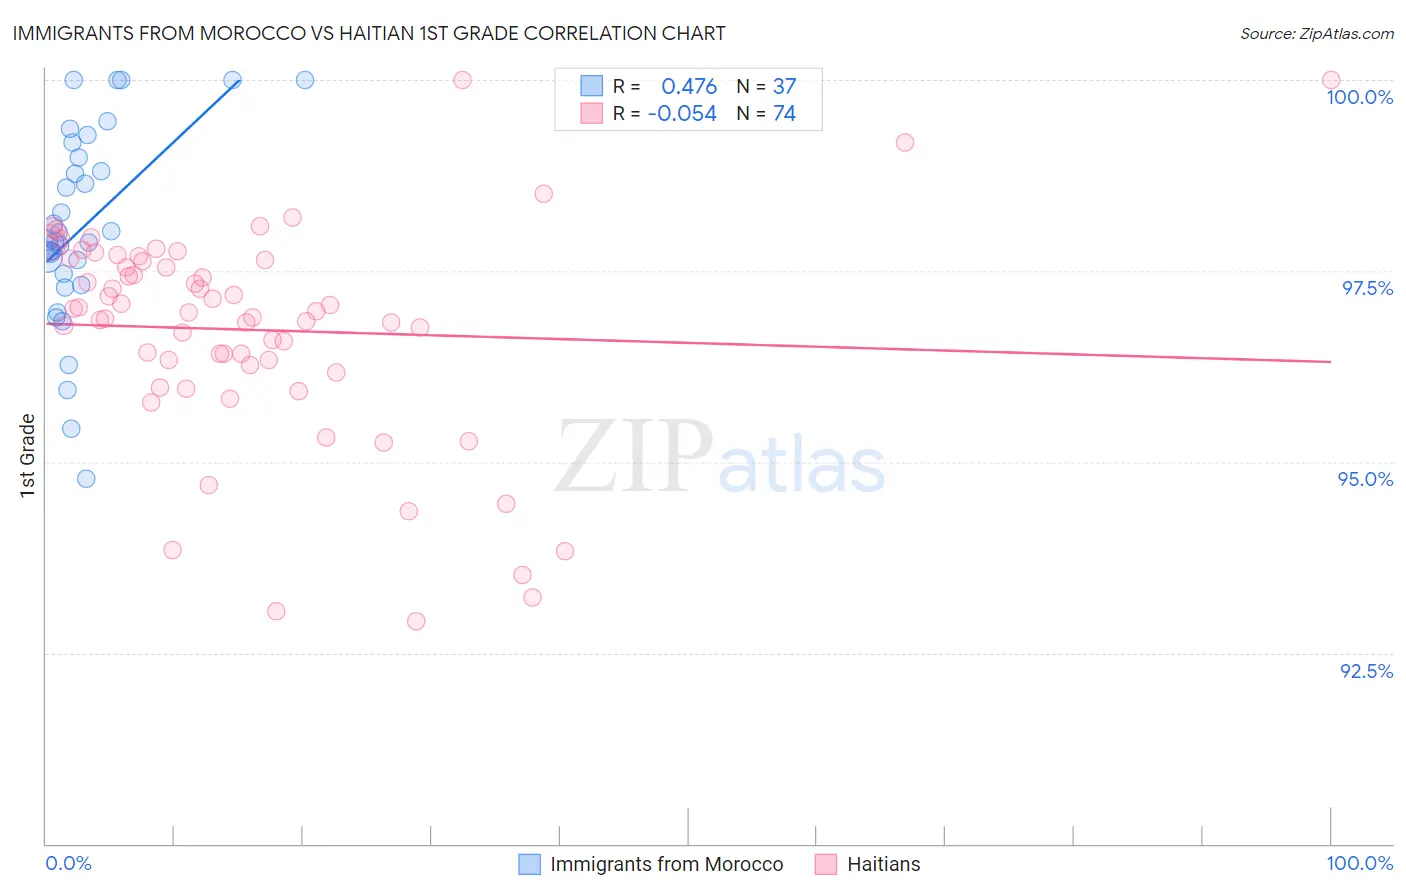
Immigrants from Morocco vs Haitian 1st Grade Correlation Chart
The statistical analysis conducted on geographies consisting of 178,912,438 people shows a moderate positive correlation between the proportion of Immigrants from Morocco and percentage of population with at least 1st grade education in the United States with a correlation coefficient (R) of 0.476 and weighted average of 97.7%. Similarly, the statistical analysis conducted on geographies consisting of 288,018,720 people shows a slight negative correlation between the proportion of Haitians and percentage of population with at least 1st grade education in the United States with a correlation coefficient (R) of -0.054 and weighted average of 97.1%, a difference of 0.63%.
1st Grade Correlation Summary
| Measurement | Immigrants from Morocco | Haitian |
| Minimum | 94.8% | 92.9% |
| Maximum | 100.0% | 100.0% |
| Range | 5.2% | 7.1% |
| Mean | 98.1% | 96.7% |
| Median | 97.9% | 97.0% |
| Interquartile 25% (IQ1) | 97.4% | 96.3% |
| Interquartile 75% (IQ3) | 99.1% | 97.6% |
| Interquartile Range (IQR) | 1.7% | 1.4% |
| Standard Deviation (Sample) | 1.3% | 1.4% |
| Standard Deviation (Population) | 1.3% | 1.4% |
Similar Demographics by 1st Grade
Demographics Similar to Immigrants from Morocco by 1st Grade
In terms of 1st grade, the demographic groups most similar to Immigrants from Morocco are Immigrants from Panama (97.7%, a difference of 0.0%), Tongan (97.7%, a difference of 0.010%), Samoan (97.7%, a difference of 0.020%), Immigrants from Sudan (97.7%, a difference of 0.020%), and Immigrants from Syria (97.7%, a difference of 0.020%).
| Demographics | Rating | Rank | 1st Grade |
| Laotians | 10.3 /100 | #211 | Poor 97.8% |
| Moroccans | 8.7 /100 | #212 | Tragic 97.7% |
| Immigrants | Bahamas | 8.1 /100 | #213 | Tragic 97.7% |
| South American Indians | 7.6 /100 | #214 | Tragic 97.7% |
| Bahamians | 7.5 /100 | #215 | Tragic 97.7% |
| Uruguayans | 7.4 /100 | #216 | Tragic 97.7% |
| Samoans | 6.8 /100 | #217 | Tragic 97.7% |
| Immigrants | Morocco | 5.3 /100 | #218 | Tragic 97.7% |
| Immigrants | Panama | 5.2 /100 | #219 | Tragic 97.7% |
| Tongans | 4.6 /100 | #220 | Tragic 97.7% |
| Immigrants | Sudan | 4.3 /100 | #221 | Tragic 97.7% |
| Immigrants | Syria | 4.2 /100 | #222 | Tragic 97.7% |
| Immigrants | Zaire | 4.1 /100 | #223 | Tragic 97.7% |
| Iraqis | 4.0 /100 | #224 | Tragic 97.7% |
| Immigrants | Nepal | 4.0 /100 | #225 | Tragic 97.7% |
Demographics Similar to Haitians by 1st Grade
In terms of 1st grade, the demographic groups most similar to Haitians are Immigrants from Dominica (97.1%, a difference of 0.010%), Immigrants from Cuba (97.1%, a difference of 0.010%), Central American Indian (97.1%, a difference of 0.030%), Immigrants from South Eastern Asia (97.1%, a difference of 0.030%), and Immigrants from Caribbean (97.0%, a difference of 0.050%).
| Demographics | Rating | Rank | 1st Grade |
| Malaysians | 0.0 /100 | #293 | Tragic 97.2% |
| Immigrants | Grenada | 0.0 /100 | #294 | Tragic 97.2% |
| Immigrants | Immigrants | 0.0 /100 | #295 | Tragic 97.2% |
| Immigrants | Eritrea | 0.0 /100 | #296 | Tragic 97.2% |
| Central American Indians | 0.0 /100 | #297 | Tragic 97.1% |
| Immigrants | Dominica | 0.0 /100 | #298 | Tragic 97.1% |
| Immigrants | Cuba | 0.0 /100 | #299 | Tragic 97.1% |
| Haitians | 0.0 /100 | #300 | Tragic 97.1% |
| Immigrants | South Eastern Asia | 0.0 /100 | #301 | Tragic 97.1% |
| Immigrants | Caribbean | 0.0 /100 | #302 | Tragic 97.0% |
| Somalis | 0.0 /100 | #303 | Tragic 97.0% |
| Nicaraguans | 0.0 /100 | #304 | Tragic 97.0% |
| Ecuadorians | 0.0 /100 | #305 | Tragic 97.0% |
| Belizeans | 0.0 /100 | #306 | Tragic 96.9% |
| Immigrants | Somalia | 0.0 /100 | #307 | Tragic 96.9% |