Immigrants from Lithuania vs Immigrants from Switzerland Wage/Income Gap
COMPARE
Immigrants from Lithuania
Immigrants from Switzerland
Wage/Income Gap
Wage/Income Gap Comparison
Immigrants from Lithuania
Immigrants from Switzerland
28.6%
WAGE/INCOME GAP
0.1/ 100
METRIC RATING
311th/ 347
METRIC RANK
27.7%
WAGE/INCOME GAP
1.0/ 100
METRIC RATING
264th/ 347
METRIC RANK
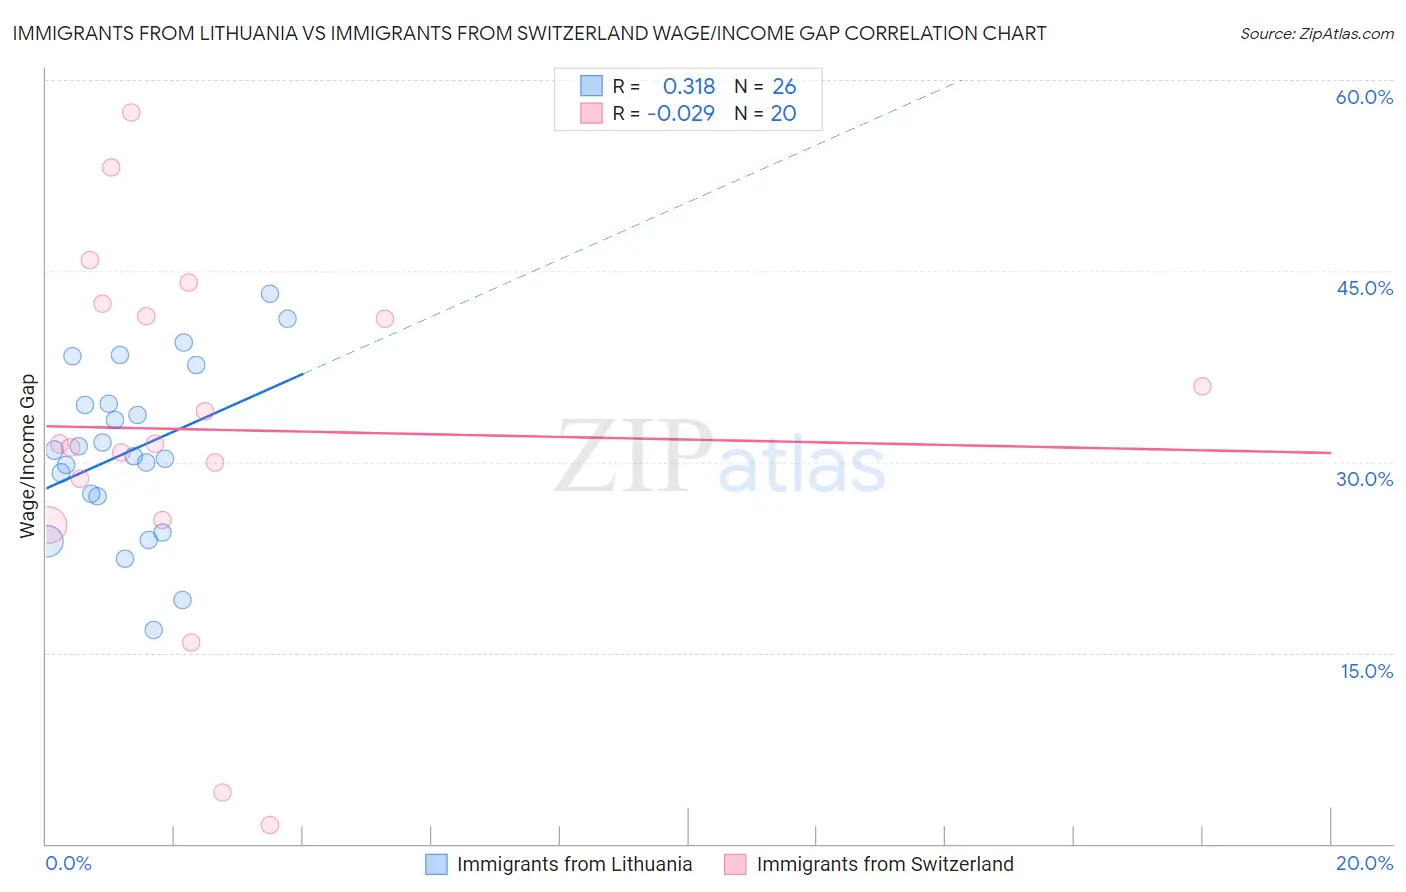
Immigrants from Lithuania vs Immigrants from Switzerland Wage/Income Gap Correlation Chart
The statistical analysis conducted on geographies consisting of 117,698,624 people shows a mild positive correlation between the proportion of Immigrants from Lithuania and wage/income gap percentage in the United States with a correlation coefficient (R) of 0.318 and weighted average of 28.6%. Similarly, the statistical analysis conducted on geographies consisting of 148,012,868 people shows no correlation between the proportion of Immigrants from Switzerland and wage/income gap percentage in the United States with a correlation coefficient (R) of -0.029 and weighted average of 27.7%, a difference of 3.3%.
Wage/Income Gap Correlation Summary
| Measurement | Immigrants from Lithuania | Immigrants from Switzerland |
| Minimum | 16.8% | 1.5% |
| Maximum | 43.2% | 57.5% |
| Range | 26.5% | 56.0% |
| Mean | 30.9% | 32.5% |
| Median | 30.7% | 31.4% |
| Interquartile 25% (IQ1) | 27.3% | 27.1% |
| Interquartile 75% (IQ3) | 34.5% | 42.0% |
| Interquartile Range (IQR) | 7.3% | 14.9% |
| Standard Deviation (Sample) | 6.7% | 14.2% |
| Standard Deviation (Population) | 6.5% | 13.8% |
Similar Demographics by Wage/Income Gap
Demographics Similar to Immigrants from Lithuania by Wage/Income Gap
In terms of wage/income gap, the demographic groups most similar to Immigrants from Lithuania are Finnish (28.6%, a difference of 0.070%), Eastern European (28.6%, a difference of 0.13%), Macedonian (28.6%, a difference of 0.16%), Polish (28.5%, a difference of 0.25%), and French (28.7%, a difference of 0.26%).
| Demographics | Rating | Rank | Wage/Income Gap |
| Immigrants | Netherlands | 0.2 /100 | #304 | Tragic 28.5% |
| Immigrants | South Africa | 0.1 /100 | #305 | Tragic 28.5% |
| Whites/Caucasians | 0.1 /100 | #306 | Tragic 28.5% |
| Immigrants | Denmark | 0.1 /100 | #307 | Tragic 28.5% |
| Poles | 0.1 /100 | #308 | Tragic 28.5% |
| Macedonians | 0.1 /100 | #309 | Tragic 28.6% |
| Finns | 0.1 /100 | #310 | Tragic 28.6% |
| Immigrants | Lithuania | 0.1 /100 | #311 | Tragic 28.6% |
| Eastern Europeans | 0.1 /100 | #312 | Tragic 28.6% |
| French | 0.1 /100 | #313 | Tragic 28.7% |
| Immigrants | Scotland | 0.1 /100 | #314 | Tragic 28.7% |
| Maltese | 0.1 /100 | #315 | Tragic 28.7% |
| Lithuanians | 0.1 /100 | #316 | Tragic 28.7% |
| Belgians | 0.1 /100 | #317 | Tragic 28.8% |
| Basques | 0.1 /100 | #318 | Tragic 28.8% |
Demographics Similar to Immigrants from Switzerland by Wage/Income Gap
In terms of wage/income gap, the demographic groups most similar to Immigrants from Switzerland are Serbian (27.7%, a difference of 0.0%), Hmong (27.7%, a difference of 0.010%), Turkish (27.7%, a difference of 0.020%), New Zealander (27.7%, a difference of 0.10%), and Potawatomi (27.7%, a difference of 0.12%).
| Demographics | Rating | Rank | Wage/Income Gap |
| Luxembourgers | 1.9 /100 | #257 | Tragic 27.4% |
| Slavs | 1.8 /100 | #258 | Tragic 27.4% |
| Icelanders | 1.8 /100 | #259 | Tragic 27.5% |
| Tongans | 1.7 /100 | #260 | Tragic 27.5% |
| Immigrants | Germany | 1.5 /100 | #261 | Tragic 27.5% |
| Immigrants | Lebanon | 1.5 /100 | #262 | Tragic 27.5% |
| Syrians | 1.4 /100 | #263 | Tragic 27.6% |
| Immigrants | Switzerland | 1.0 /100 | #264 | Tragic 27.7% |
| Serbians | 1.0 /100 | #265 | Tragic 27.7% |
| Hmong | 1.0 /100 | #266 | Tragic 27.7% |
| Turks | 1.0 /100 | #267 | Tragic 27.7% |
| New Zealanders | 1.0 /100 | #268 | Tragic 27.7% |
| Potawatomi | 0.9 /100 | #269 | Tragic 27.7% |
| Immigrants | Western Europe | 0.9 /100 | #270 | Tragic 27.8% |
| Ute | 0.8 /100 | #271 | Tragic 27.8% |