Immigrants from Dominican Republic vs Marshallese Median Earnings
COMPARE
Immigrants from Dominican Republic
Marshallese
Median Earnings
Median Earnings Comparison
Immigrants from Dominican Republic
Marshallese
$41,554
MEDIAN EARNINGS
0.1/ 100
METRIC RATING
288th/ 347
METRIC RANK
$41,969
MEDIAN EARNINGS
0.2/ 100
METRIC RATING
281st/ 347
METRIC RANK
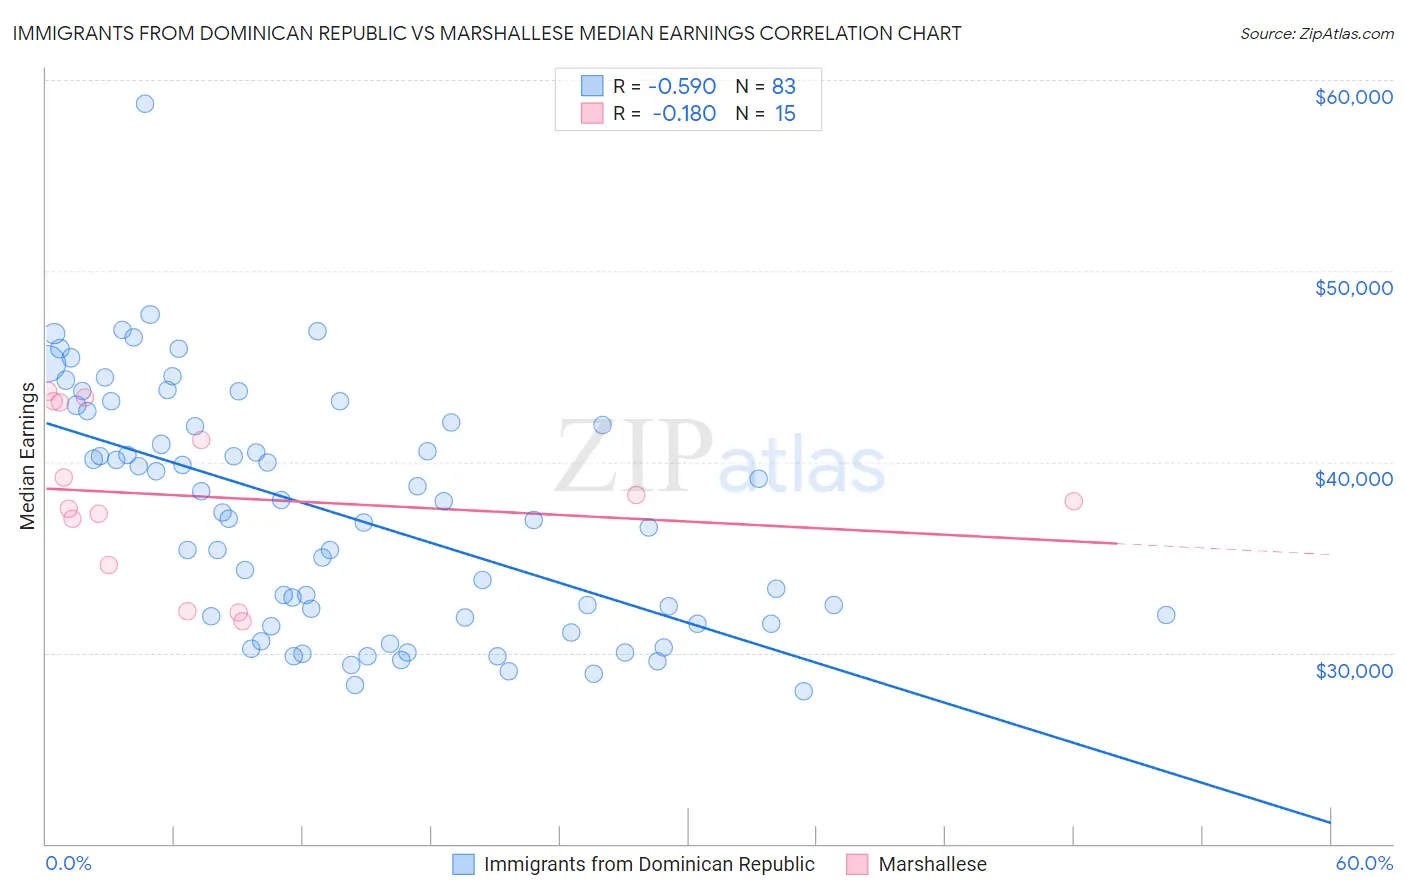
Immigrants from Dominican Republic vs Marshallese Median Earnings Correlation Chart
The statistical analysis conducted on geographies consisting of 275,134,235 people shows a substantial negative correlation between the proportion of Immigrants from Dominican Republic and median earnings in the United States with a correlation coefficient (R) of -0.590 and weighted average of $41,554. Similarly, the statistical analysis conducted on geographies consisting of 14,760,991 people shows a poor negative correlation between the proportion of Marshallese and median earnings in the United States with a correlation coefficient (R) of -0.180 and weighted average of $41,969, a difference of 1.0%.
Median Earnings Correlation Summary
| Measurement | Immigrants from Dominican Republic | Marshallese |
| Minimum | $28,009 | $31,625 |
| Maximum | $58,780 | $43,685 |
| Range | $30,771 | $12,060 |
| Mean | $37,276 | $38,147 |
| Median | $37,042 | $37,917 |
| Interquartile 25% (IQ1) | $31,535 | $34,587 |
| Interquartile 75% (IQ3) | $42,082 | $43,141 |
| Interquartile Range (IQR) | $10,547 | $8,554 |
| Standard Deviation (Sample) | $6,269 | $4,207 |
| Standard Deviation (Population) | $6,231 | $4,065 |
Demographics Similar to Immigrants from Dominican Republic and Marshallese by Median Earnings
In terms of median earnings, the demographic groups most similar to Immigrants from Dominican Republic are Comanche ($41,519, a difference of 0.080%), Paiute ($41,508, a difference of 0.11%), Central American Indian ($41,474, a difference of 0.19%), U.S. Virgin Islander ($41,448, a difference of 0.26%), and Indonesian ($41,701, a difference of 0.35%). Similarly, the demographic groups most similar to Marshallese are African ($41,955, a difference of 0.030%), Dominican ($41,864, a difference of 0.25%), Hmong ($42,111, a difference of 0.34%), Blackfeet ($41,822, a difference of 0.35%), and Colville ($42,151, a difference of 0.43%).
| Demographics | Rating | Rank | Median Earnings |
| Immigrants | El Salvador | 0.4 /100 | #274 | Tragic $42,413 |
| Immigrants | Belize | 0.3 /100 | #275 | Tragic $42,339 |
| Spanish Americans | 0.3 /100 | #276 | Tragic $42,316 |
| Central Americans | 0.3 /100 | #277 | Tragic $42,280 |
| Cajuns | 0.3 /100 | #278 | Tragic $42,189 |
| Colville | 0.2 /100 | #279 | Tragic $42,151 |
| Hmong | 0.2 /100 | #280 | Tragic $42,111 |
| Marshallese | 0.2 /100 | #281 | Tragic $41,969 |
| Africans | 0.2 /100 | #282 | Tragic $41,955 |
| Dominicans | 0.2 /100 | #283 | Tragic $41,864 |
| Blackfeet | 0.2 /100 | #284 | Tragic $41,822 |
| Immigrants | Nicaragua | 0.1 /100 | #285 | Tragic $41,737 |
| Mexican American Indians | 0.1 /100 | #286 | Tragic $41,719 |
| Indonesians | 0.1 /100 | #287 | Tragic $41,701 |
| Immigrants | Dominican Republic | 0.1 /100 | #288 | Tragic $41,554 |
| Comanche | 0.1 /100 | #289 | Tragic $41,519 |
| Paiute | 0.1 /100 | #290 | Tragic $41,508 |
| Central American Indians | 0.1 /100 | #291 | Tragic $41,474 |
| U.S. Virgin Islanders | 0.1 /100 | #292 | Tragic $41,448 |
| Immigrants | Zaire | 0.1 /100 | #293 | Tragic $41,325 |
| Potawatomi | 0.1 /100 | #294 | Tragic $41,288 |