Immigrants from Liberia vs Marshallese Median Female Earnings
COMPARE
Immigrants from Liberia
Marshallese
Median Female Earnings
Median Female Earnings Comparison
Immigrants from Liberia
Marshallese
$37,970
MEDIAN FEMALE EARNINGS
2.7/ 100
METRIC RATING
244th/ 347
METRIC RANK
$36,459
MEDIAN FEMALE EARNINGS
0.1/ 100
METRIC RATING
277th/ 347
METRIC RANK
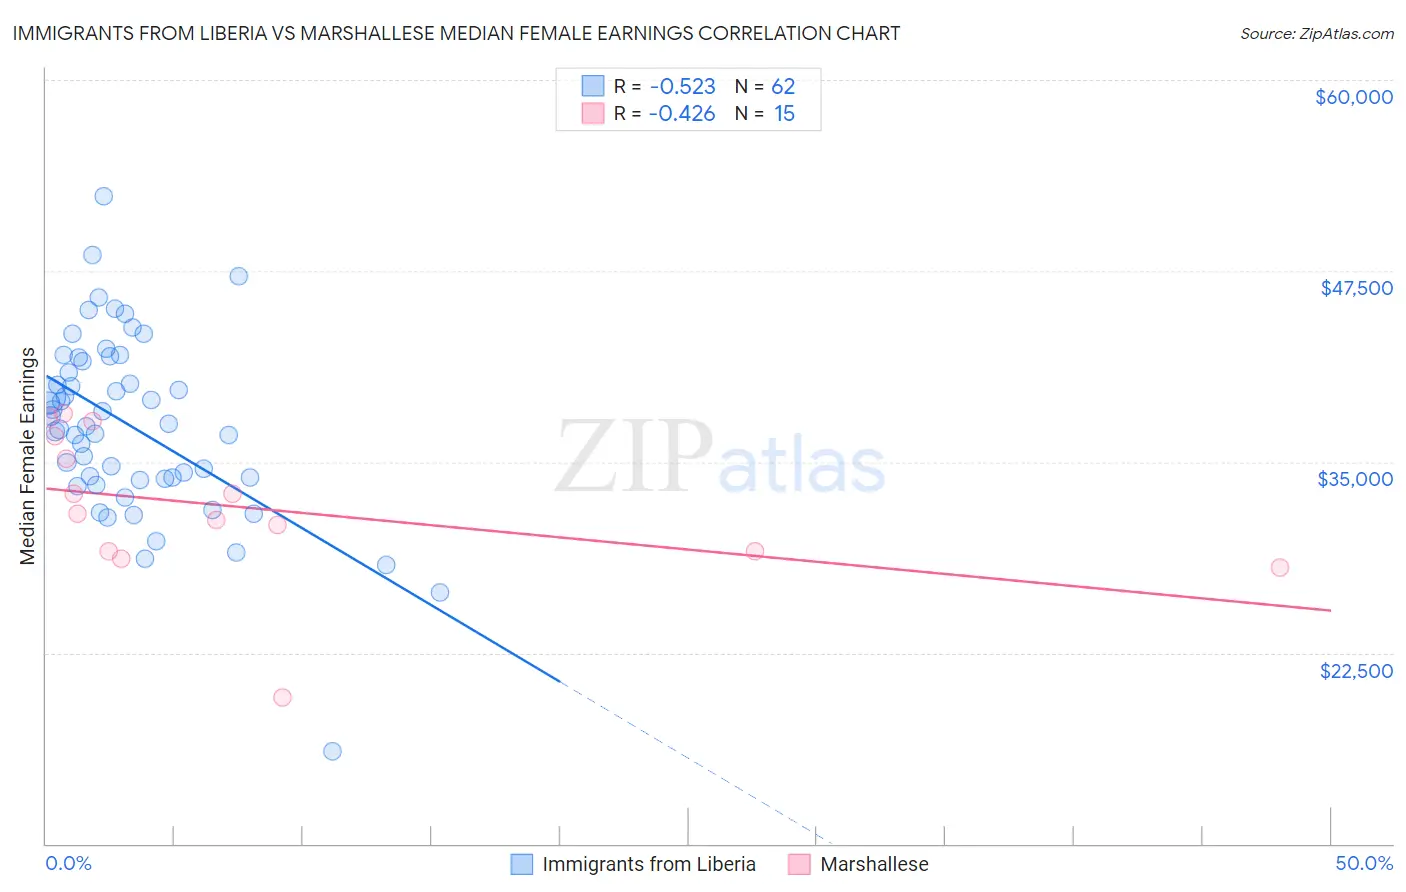
Immigrants from Liberia vs Marshallese Median Female Earnings Correlation Chart
The statistical analysis conducted on geographies consisting of 135,268,038 people shows a substantial negative correlation between the proportion of Immigrants from Liberia and median female earnings in the United States with a correlation coefficient (R) of -0.523 and weighted average of $37,970. Similarly, the statistical analysis conducted on geographies consisting of 14,760,991 people shows a moderate negative correlation between the proportion of Marshallese and median female earnings in the United States with a correlation coefficient (R) of -0.426 and weighted average of $36,459, a difference of 4.1%.
Median Female Earnings Correlation Summary
| Measurement | Immigrants from Liberia | Marshallese |
| Minimum | $16,076 | $19,583 |
| Maximum | $52,381 | $38,170 |
| Range | $36,305 | $18,587 |
| Mean | $37,357 | $31,981 |
| Median | $37,425 | $31,627 |
| Interquartile 25% (IQ1) | $33,898 | $29,109 |
| Interquartile 75% (IQ3) | $41,557 | $36,675 |
| Interquartile Range (IQR) | $7,659 | $7,566 |
| Standard Deviation (Sample) | $5,953 | $4,908 |
| Standard Deviation (Population) | $5,904 | $4,742 |
Similar Demographics by Median Female Earnings
Demographics Similar to Immigrants from Liberia by Median Female Earnings
In terms of median female earnings, the demographic groups most similar to Immigrants from Liberia are Immigrants from Middle Africa ($37,965, a difference of 0.010%), Delaware ($37,964, a difference of 0.010%), German ($37,986, a difference of 0.040%), Immigrants from Burma/Myanmar ($38,028, a difference of 0.15%), and Immigrants from Somalia ($37,914, a difference of 0.15%).
| Demographics | Rating | Rank | Median Female Earnings |
| Immigrants | Cabo Verde | 4.3 /100 | #237 | Tragic $38,208 |
| Alaska Natives | 4.3 /100 | #238 | Tragic $38,202 |
| English | 4.2 /100 | #239 | Tragic $38,196 |
| Finns | 4.0 /100 | #240 | Tragic $38,173 |
| Spanish | 3.5 /100 | #241 | Tragic $38,098 |
| Immigrants | Burma/Myanmar | 3.0 /100 | #242 | Tragic $38,028 |
| Germans | 2.8 /100 | #243 | Tragic $37,986 |
| Immigrants | Liberia | 2.7 /100 | #244 | Tragic $37,970 |
| Immigrants | Middle Africa | 2.7 /100 | #245 | Tragic $37,965 |
| Delaware | 2.6 /100 | #246 | Tragic $37,964 |
| Immigrants | Somalia | 2.4 /100 | #247 | Tragic $37,914 |
| Alaskan Athabascans | 2.3 /100 | #248 | Tragic $37,905 |
| Swiss | 2.3 /100 | #249 | Tragic $37,904 |
| Immigrants | Iraq | 2.2 /100 | #250 | Tragic $37,864 |
| Welsh | 2.1 /100 | #251 | Tragic $37,856 |
Demographics Similar to Marshallese by Median Female Earnings
In terms of median female earnings, the demographic groups most similar to Marshallese are Central American ($36,492, a difference of 0.090%), U.S. Virgin Islander ($36,424, a difference of 0.10%), Immigrants from Caribbean ($36,414, a difference of 0.12%), Iroquois ($36,408, a difference of 0.14%), and African ($36,530, a difference of 0.19%).
| Demographics | Rating | Rank | Median Female Earnings |
| French American Indians | 0.3 /100 | #270 | Tragic $36,920 |
| Nicaraguans | 0.3 /100 | #271 | Tragic $36,904 |
| Immigrants | Dominican Republic | 0.3 /100 | #272 | Tragic $36,857 |
| Immigrants | Laos | 0.3 /100 | #273 | Tragic $36,841 |
| Immigrants | El Salvador | 0.2 /100 | #274 | Tragic $36,673 |
| Africans | 0.1 /100 | #275 | Tragic $36,530 |
| Central Americans | 0.1 /100 | #276 | Tragic $36,492 |
| Marshallese | 0.1 /100 | #277 | Tragic $36,459 |
| U.S. Virgin Islanders | 0.1 /100 | #278 | Tragic $36,424 |
| Immigrants | Caribbean | 0.1 /100 | #279 | Tragic $36,414 |
| Iroquois | 0.1 /100 | #280 | Tragic $36,408 |
| Spanish Americans | 0.1 /100 | #281 | Tragic $36,391 |
| Haitians | 0.1 /100 | #282 | Tragic $36,374 |
| Immigrants | Haiti | 0.1 /100 | #283 | Tragic $36,203 |
| Indonesians | 0.1 /100 | #284 | Tragic $36,140 |