Kiowa vs Marshallese Median Earnings
COMPARE
Kiowa
Marshallese
Median Earnings
Median Earnings Comparison
Kiowa
Marshallese
$39,232
MEDIAN EARNINGS
0.0/ 100
METRIC RATING
329th/ 347
METRIC RANK
$41,969
MEDIAN EARNINGS
0.2/ 100
METRIC RATING
281st/ 347
METRIC RANK
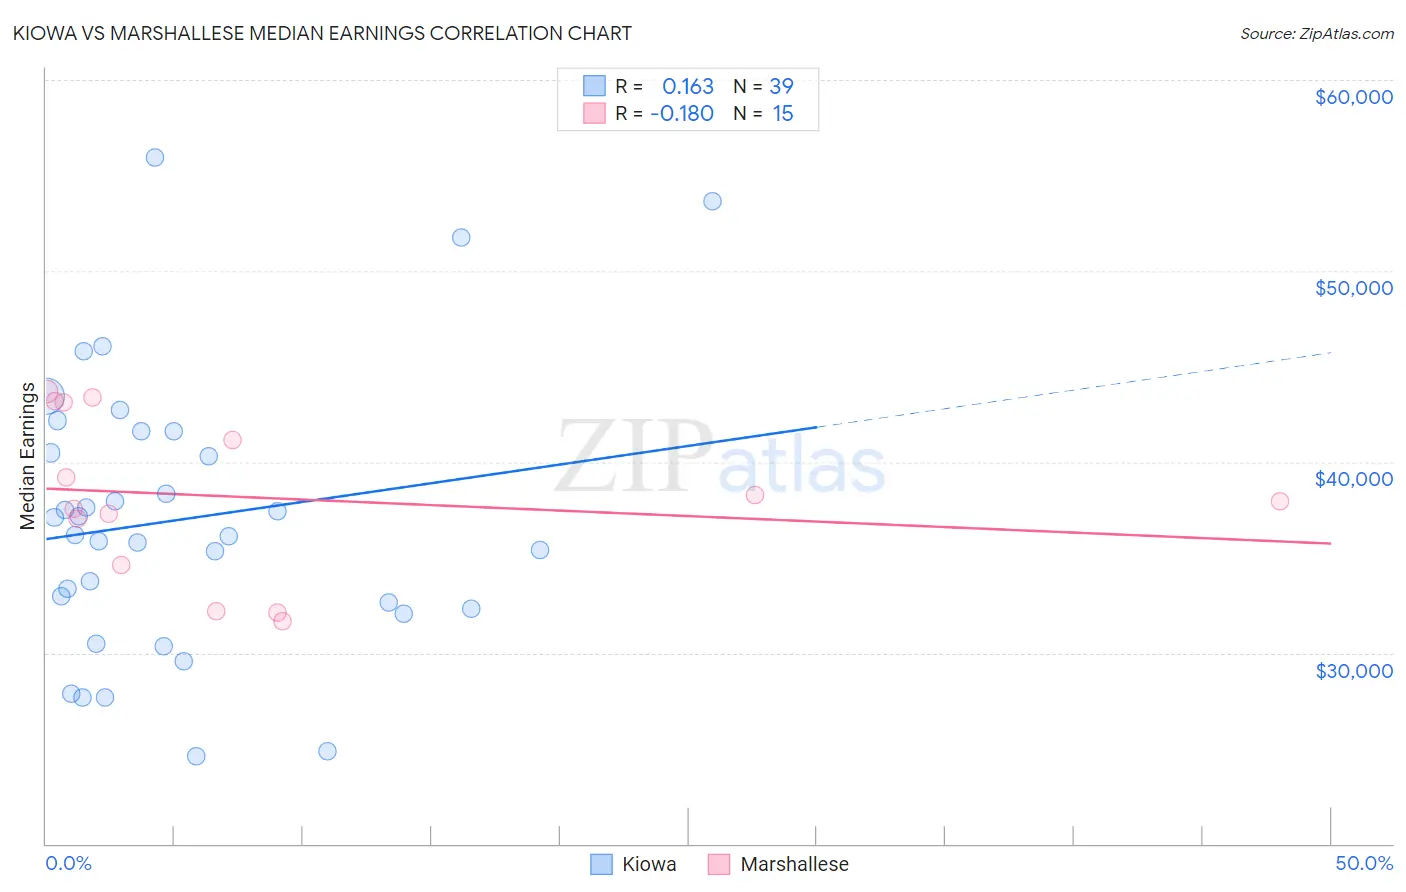
Kiowa vs Marshallese Median Earnings Correlation Chart
The statistical analysis conducted on geographies consisting of 56,100,586 people shows a poor positive correlation between the proportion of Kiowa and median earnings in the United States with a correlation coefficient (R) of 0.163 and weighted average of $39,232. Similarly, the statistical analysis conducted on geographies consisting of 14,760,991 people shows a poor negative correlation between the proportion of Marshallese and median earnings in the United States with a correlation coefficient (R) of -0.180 and weighted average of $41,969, a difference of 7.0%.
Median Earnings Correlation Summary
| Measurement | Kiowa | Marshallese |
| Minimum | $24,615 | $31,625 |
| Maximum | $55,938 | $43,685 |
| Range | $31,323 | $12,060 |
| Mean | $37,003 | $38,147 |
| Median | $36,193 | $37,917 |
| Interquartile 25% (IQ1) | $32,335 | $34,587 |
| Interquartile 75% (IQ3) | $41,599 | $43,141 |
| Interquartile Range (IQR) | $9,264 | $8,554 |
| Standard Deviation (Sample) | $7,253 | $4,207 |
| Standard Deviation (Population) | $7,159 | $4,065 |
Similar Demographics by Median Earnings
Demographics Similar to Kiowa by Median Earnings
In terms of median earnings, the demographic groups most similar to Kiowa are Immigrants from Congo ($39,169, a difference of 0.16%), Immigrants from Mexico ($39,114, a difference of 0.30%), Yakama ($39,107, a difference of 0.32%), Sioux ($39,448, a difference of 0.55%), and Houma ($38,949, a difference of 0.73%).
| Demographics | Rating | Rank | Median Earnings |
| Immigrants | Central America | 0.0 /100 | #322 | Tragic $39,762 |
| Bahamians | 0.0 /100 | #323 | Tragic $39,735 |
| Ottawa | 0.0 /100 | #324 | Tragic $39,721 |
| Creek | 0.0 /100 | #325 | Tragic $39,648 |
| Immigrants | Yemen | 0.0 /100 | #326 | Tragic $39,540 |
| Yuman | 0.0 /100 | #327 | Tragic $39,523 |
| Sioux | 0.0 /100 | #328 | Tragic $39,448 |
| Kiowa | 0.0 /100 | #329 | Tragic $39,232 |
| Immigrants | Congo | 0.0 /100 | #330 | Tragic $39,169 |
| Immigrants | Mexico | 0.0 /100 | #331 | Tragic $39,114 |
| Yakama | 0.0 /100 | #332 | Tragic $39,107 |
| Houma | 0.0 /100 | #333 | Tragic $38,949 |
| Spanish American Indians | 0.0 /100 | #334 | Tragic $38,907 |
| Natives/Alaskans | 0.0 /100 | #335 | Tragic $38,896 |
| Crow | 0.0 /100 | #336 | Tragic $38,707 |
Demographics Similar to Marshallese by Median Earnings
In terms of median earnings, the demographic groups most similar to Marshallese are African ($41,955, a difference of 0.030%), Dominican ($41,864, a difference of 0.25%), Hmong ($42,111, a difference of 0.34%), Blackfeet ($41,822, a difference of 0.35%), and Colville ($42,151, a difference of 0.43%).
| Demographics | Rating | Rank | Median Earnings |
| Immigrants | El Salvador | 0.4 /100 | #274 | Tragic $42,413 |
| Immigrants | Belize | 0.3 /100 | #275 | Tragic $42,339 |
| Spanish Americans | 0.3 /100 | #276 | Tragic $42,316 |
| Central Americans | 0.3 /100 | #277 | Tragic $42,280 |
| Cajuns | 0.3 /100 | #278 | Tragic $42,189 |
| Colville | 0.2 /100 | #279 | Tragic $42,151 |
| Hmong | 0.2 /100 | #280 | Tragic $42,111 |
| Marshallese | 0.2 /100 | #281 | Tragic $41,969 |
| Africans | 0.2 /100 | #282 | Tragic $41,955 |
| Dominicans | 0.2 /100 | #283 | Tragic $41,864 |
| Blackfeet | 0.2 /100 | #284 | Tragic $41,822 |
| Immigrants | Nicaragua | 0.1 /100 | #285 | Tragic $41,737 |
| Mexican American Indians | 0.1 /100 | #286 | Tragic $41,719 |
| Indonesians | 0.1 /100 | #287 | Tragic $41,701 |
| Immigrants | Dominican Republic | 0.1 /100 | #288 | Tragic $41,554 |