Arab vs Marshallese Median Earnings
COMPARE
Arab
Marshallese
Median Earnings
Median Earnings Comparison
Arabs
Marshallese
$48,599
MEDIAN EARNINGS
95.4/ 100
METRIC RATING
121st/ 347
METRIC RANK
$41,969
MEDIAN EARNINGS
0.2/ 100
METRIC RATING
281st/ 347
METRIC RANK
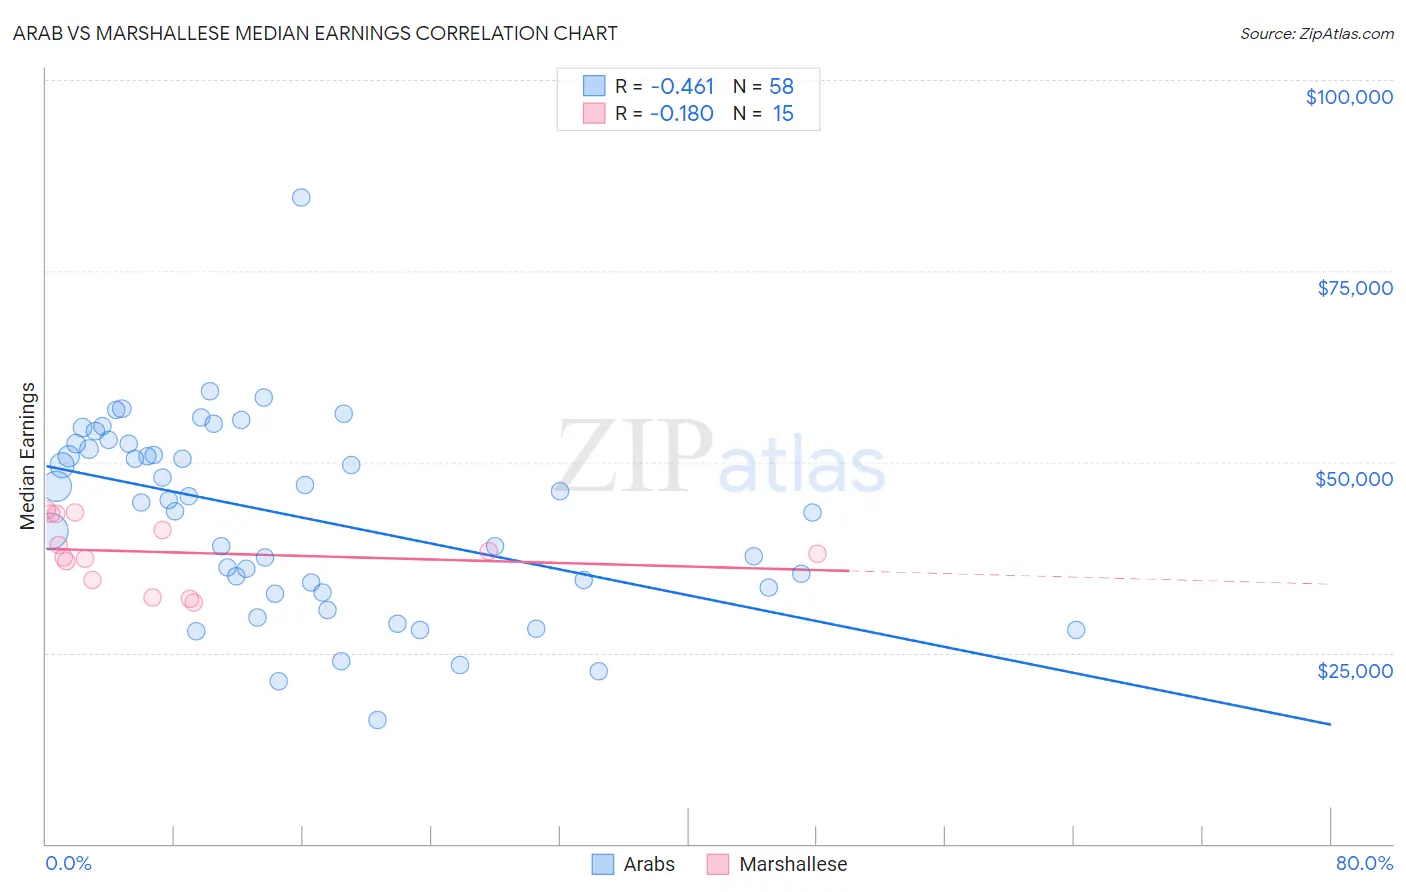
Arab vs Marshallese Median Earnings Correlation Chart
The statistical analysis conducted on geographies consisting of 486,850,484 people shows a moderate negative correlation between the proportion of Arabs and median earnings in the United States with a correlation coefficient (R) of -0.461 and weighted average of $48,599. Similarly, the statistical analysis conducted on geographies consisting of 14,760,991 people shows a poor negative correlation between the proportion of Marshallese and median earnings in the United States with a correlation coefficient (R) of -0.180 and weighted average of $41,969, a difference of 15.8%.
Median Earnings Correlation Summary
| Measurement | Arab | Marshallese |
| Minimum | $16,192 | $31,625 |
| Maximum | $84,560 | $43,685 |
| Range | $68,368 | $12,060 |
| Mean | $42,864 | $38,147 |
| Median | $44,810 | $37,917 |
| Interquartile 25% (IQ1) | $33,563 | $34,587 |
| Interquartile 75% (IQ3) | $52,424 | $43,141 |
| Interquartile Range (IQR) | $18,861 | $8,554 |
| Standard Deviation (Sample) | $12,577 | $4,207 |
| Standard Deviation (Population) | $12,468 | $4,065 |
Similar Demographics by Median Earnings
Demographics Similar to Arabs by Median Earnings
In terms of median earnings, the demographic groups most similar to Arabs are Carpatho Rusyn ($48,617, a difference of 0.040%), Polish ($48,659, a difference of 0.12%), Immigrants from Jordan ($48,673, a difference of 0.15%), Serbian ($48,677, a difference of 0.16%), and Chilean ($48,504, a difference of 0.19%).
| Demographics | Rating | Rank | Median Earnings |
| Moroccans | 96.7 /100 | #114 | Exceptional $48,838 |
| Chinese | 96.7 /100 | #115 | Exceptional $48,836 |
| Koreans | 96.2 /100 | #116 | Exceptional $48,727 |
| Serbians | 95.9 /100 | #117 | Exceptional $48,677 |
| Immigrants | Jordan | 95.9 /100 | #118 | Exceptional $48,673 |
| Poles | 95.8 /100 | #119 | Exceptional $48,659 |
| Carpatho Rusyns | 95.5 /100 | #120 | Exceptional $48,617 |
| Arabs | 95.4 /100 | #121 | Exceptional $48,599 |
| Chileans | 94.8 /100 | #122 | Exceptional $48,504 |
| Immigrants | Syria | 93.9 /100 | #123 | Exceptional $48,375 |
| Brazilians | 93.7 /100 | #124 | Exceptional $48,356 |
| Immigrants | Fiji | 93.3 /100 | #125 | Exceptional $48,305 |
| Assyrians/Chaldeans/Syriacs | 93.3 /100 | #126 | Exceptional $48,304 |
| Sierra Leoneans | 93.1 /100 | #127 | Exceptional $48,286 |
| Immigrants | Philippines | 92.9 /100 | #128 | Exceptional $48,266 |
Demographics Similar to Marshallese by Median Earnings
In terms of median earnings, the demographic groups most similar to Marshallese are African ($41,955, a difference of 0.030%), Dominican ($41,864, a difference of 0.25%), Hmong ($42,111, a difference of 0.34%), Blackfeet ($41,822, a difference of 0.35%), and Colville ($42,151, a difference of 0.43%).
| Demographics | Rating | Rank | Median Earnings |
| Immigrants | El Salvador | 0.4 /100 | #274 | Tragic $42,413 |
| Immigrants | Belize | 0.3 /100 | #275 | Tragic $42,339 |
| Spanish Americans | 0.3 /100 | #276 | Tragic $42,316 |
| Central Americans | 0.3 /100 | #277 | Tragic $42,280 |
| Cajuns | 0.3 /100 | #278 | Tragic $42,189 |
| Colville | 0.2 /100 | #279 | Tragic $42,151 |
| Hmong | 0.2 /100 | #280 | Tragic $42,111 |
| Marshallese | 0.2 /100 | #281 | Tragic $41,969 |
| Africans | 0.2 /100 | #282 | Tragic $41,955 |
| Dominicans | 0.2 /100 | #283 | Tragic $41,864 |
| Blackfeet | 0.2 /100 | #284 | Tragic $41,822 |
| Immigrants | Nicaragua | 0.1 /100 | #285 | Tragic $41,737 |
| Mexican American Indians | 0.1 /100 | #286 | Tragic $41,719 |
| Indonesians | 0.1 /100 | #287 | Tragic $41,701 |
| Immigrants | Dominican Republic | 0.1 /100 | #288 | Tragic $41,554 |