Estonian vs Basque Median Earnings
COMPARE
Estonian
Basque
Median Earnings
Median Earnings Comparison
Estonians
Basques
$51,772
MEDIAN EARNINGS
99.9/ 100
METRIC RATING
52nd/ 347
METRIC RANK
$46,399
MEDIAN EARNINGS
48.8/ 100
METRIC RATING
175th/ 347
METRIC RANK
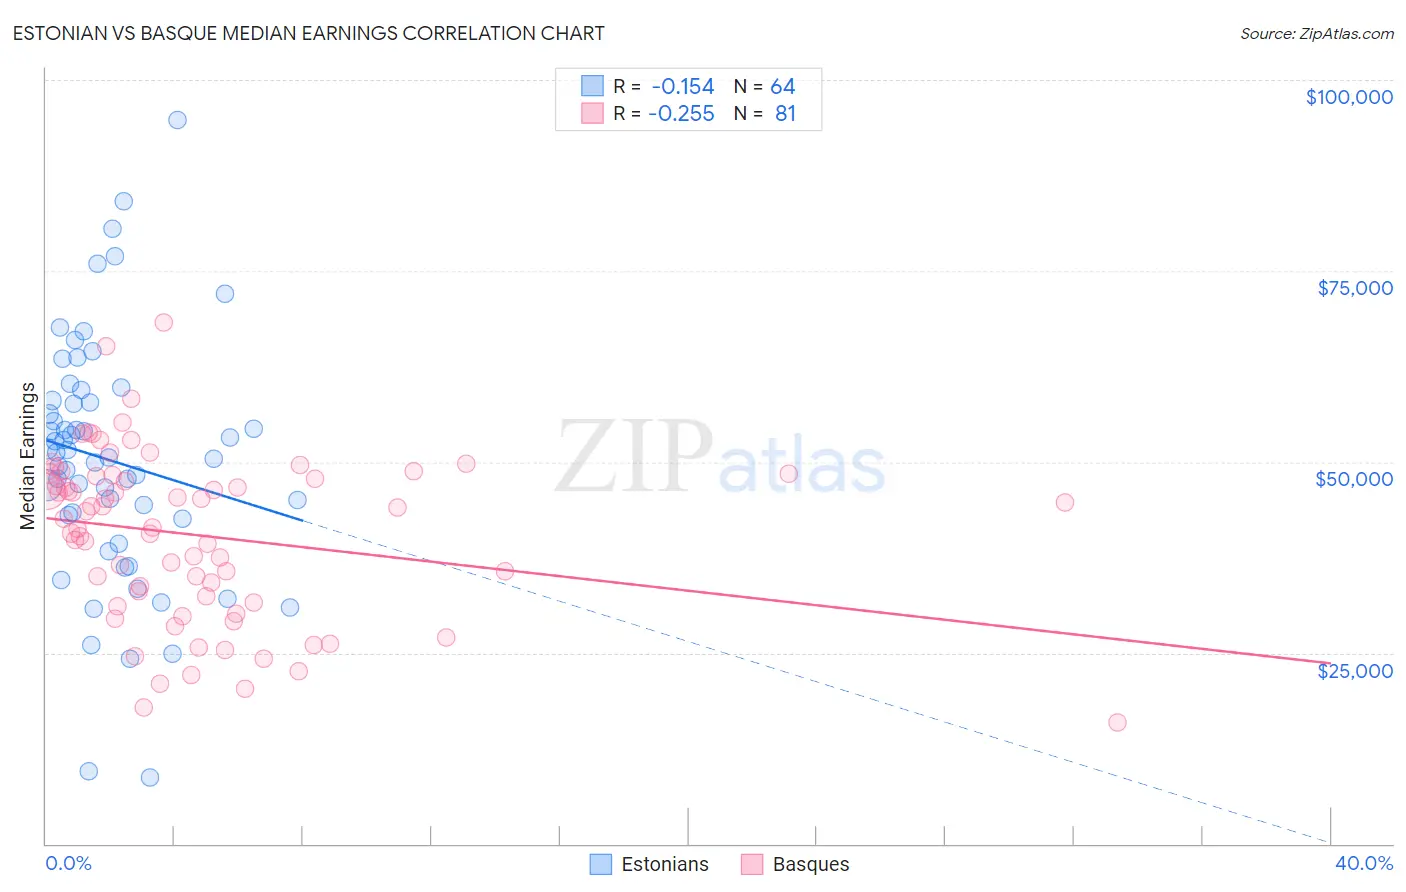
Estonian vs Basque Median Earnings Correlation Chart
The statistical analysis conducted on geographies consisting of 123,525,631 people shows a poor negative correlation between the proportion of Estonians and median earnings in the United States with a correlation coefficient (R) of -0.154 and weighted average of $51,772. Similarly, the statistical analysis conducted on geographies consisting of 165,772,846 people shows a weak negative correlation between the proportion of Basques and median earnings in the United States with a correlation coefficient (R) of -0.255 and weighted average of $46,399, a difference of 11.6%.
Median Earnings Correlation Summary
| Measurement | Estonian | Basque |
| Minimum | $8,672 | $15,833 |
| Maximum | $94,792 | $68,304 |
| Range | $86,120 | $52,471 |
| Mean | $50,194 | $40,382 |
| Median | $50,958 | $42,566 |
| Interquartile 25% (IQ1) | $42,740 | $32,007 |
| Interquartile 75% (IQ3) | $57,865 | $48,221 |
| Interquartile Range (IQR) | $15,125 | $16,214 |
| Standard Deviation (Sample) | $15,990 | $10,903 |
| Standard Deviation (Population) | $15,865 | $10,835 |
Similar Demographics by Median Earnings
Demographics Similar to Estonians by Median Earnings
In terms of median earnings, the demographic groups most similar to Estonians are Immigrants from Norway ($51,758, a difference of 0.030%), Immigrants from Austria ($51,826, a difference of 0.10%), Immigrants from Indonesia ($51,715, a difference of 0.11%), Egyptian ($51,701, a difference of 0.14%), and Immigrants from South Africa ($51,850, a difference of 0.15%).
| Demographics | Rating | Rank | Median Earnings |
| Immigrants | Czechoslovakia | 100.0 /100 | #45 | Exceptional $52,361 |
| Bhutanese | 100.0 /100 | #46 | Exceptional $52,297 |
| Australians | 100.0 /100 | #47 | Exceptional $52,294 |
| Immigrants | Europe | 100.0 /100 | #48 | Exceptional $52,195 |
| Bolivians | 100.0 /100 | #49 | Exceptional $52,005 |
| Immigrants | South Africa | 100.0 /100 | #50 | Exceptional $51,850 |
| Immigrants | Austria | 99.9 /100 | #51 | Exceptional $51,826 |
| Estonians | 99.9 /100 | #52 | Exceptional $51,772 |
| Immigrants | Norway | 99.9 /100 | #53 | Exceptional $51,758 |
| Immigrants | Indonesia | 99.9 /100 | #54 | Exceptional $51,715 |
| Egyptians | 99.9 /100 | #55 | Exceptional $51,701 |
| Immigrants | Pakistan | 99.9 /100 | #56 | Exceptional $51,693 |
| Immigrants | Eastern Europe | 99.9 /100 | #57 | Exceptional $51,624 |
| Immigrants | Bolivia | 99.9 /100 | #58 | Exceptional $51,605 |
| Immigrants | Croatia | 99.9 /100 | #59 | Exceptional $51,581 |
Demographics Similar to Basques by Median Earnings
In terms of median earnings, the demographic groups most similar to Basques are Danish ($46,392, a difference of 0.020%), Belgian ($46,375, a difference of 0.050%), Scandinavian ($46,433, a difference of 0.070%), Ghanaian ($46,440, a difference of 0.090%), and Colombian ($46,349, a difference of 0.11%).
| Demographics | Rating | Rank | Median Earnings |
| Immigrants | Africa | 54.6 /100 | #168 | Average $46,564 |
| Immigrants | South America | 54.0 /100 | #169 | Average $46,548 |
| Immigrants | Immigrants | 51.6 /100 | #170 | Average $46,478 |
| Scottish | 51.1 /100 | #171 | Average $46,463 |
| Kenyans | 51.0 /100 | #172 | Average $46,462 |
| Ghanaians | 50.3 /100 | #173 | Average $46,440 |
| Scandinavians | 50.0 /100 | #174 | Average $46,433 |
| Basques | 48.8 /100 | #175 | Average $46,399 |
| Danes | 48.6 /100 | #176 | Average $46,392 |
| Belgians | 48.0 /100 | #177 | Average $46,375 |
| Colombians | 47.1 /100 | #178 | Average $46,349 |
| English | 46.5 /100 | #179 | Average $46,334 |
| Puget Sound Salish | 46.5 /100 | #180 | Average $46,333 |
| Immigrants | Cameroon | 46.4 /100 | #181 | Average $46,329 |
| Swiss | 45.9 /100 | #182 | Average $46,315 |