British West Indian vs Basque Median Earnings
COMPARE
British West Indian
Basque
Median Earnings
Median Earnings Comparison
British West Indians
Basques
$44,552
MEDIAN EARNINGS
6.7/ 100
METRIC RATING
236th/ 347
METRIC RANK
$46,399
MEDIAN EARNINGS
48.8/ 100
METRIC RATING
175th/ 347
METRIC RANK
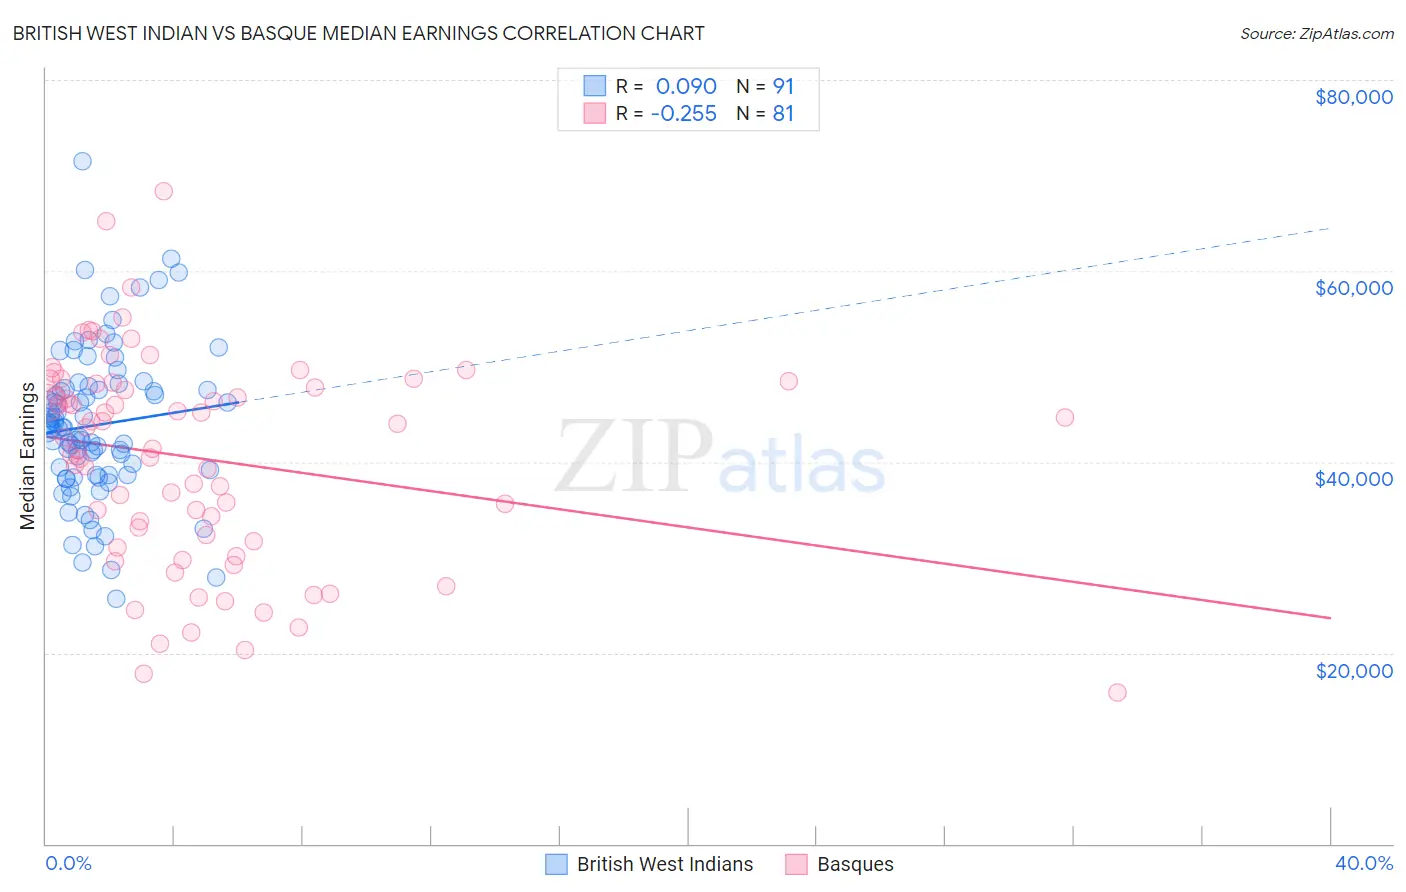
British West Indian vs Basque Median Earnings Correlation Chart
The statistical analysis conducted on geographies consisting of 152,701,918 people shows a slight positive correlation between the proportion of British West Indians and median earnings in the United States with a correlation coefficient (R) of 0.090 and weighted average of $44,552. Similarly, the statistical analysis conducted on geographies consisting of 165,772,846 people shows a weak negative correlation between the proportion of Basques and median earnings in the United States with a correlation coefficient (R) of -0.255 and weighted average of $46,399, a difference of 4.2%.
Median Earnings Correlation Summary
| Measurement | British West Indian | Basque |
| Minimum | $25,617 | $15,833 |
| Maximum | $71,446 | $68,304 |
| Range | $45,829 | $52,471 |
| Mean | $43,859 | $40,382 |
| Median | $43,512 | $42,566 |
| Interquartile 25% (IQ1) | $38,648 | $32,007 |
| Interquartile 75% (IQ3) | $47,645 | $48,221 |
| Interquartile Range (IQR) | $8,997 | $16,214 |
| Standard Deviation (Sample) | $7,987 | $10,903 |
| Standard Deviation (Population) | $7,943 | $10,835 |
Similar Demographics by Median Earnings
Demographics Similar to British West Indians by Median Earnings
In terms of median earnings, the demographic groups most similar to British West Indians are Venezuelan ($44,580, a difference of 0.060%), Cape Verdean ($44,640, a difference of 0.20%), Immigrants from Ecuador ($44,462, a difference of 0.20%), Sudanese ($44,419, a difference of 0.30%), and Senegalese ($44,373, a difference of 0.40%).
| Demographics | Rating | Rank | Median Earnings |
| Scotch-Irish | 10.7 /100 | #229 | Poor $44,924 |
| Immigrants | Western Africa | 10.3 /100 | #230 | Poor $44,893 |
| Japanese | 9.5 /100 | #231 | Tragic $44,825 |
| Delaware | 9.0 /100 | #232 | Tragic $44,783 |
| Immigrants | Sudan | 8.8 /100 | #233 | Tragic $44,767 |
| Cape Verdeans | 7.5 /100 | #234 | Tragic $44,640 |
| Venezuelans | 6.9 /100 | #235 | Tragic $44,580 |
| British West Indians | 6.7 /100 | #236 | Tragic $44,552 |
| Immigrants | Ecuador | 5.9 /100 | #237 | Tragic $44,462 |
| Sudanese | 5.6 /100 | #238 | Tragic $44,419 |
| Senegalese | 5.3 /100 | #239 | Tragic $44,373 |
| Aleuts | 4.4 /100 | #240 | Tragic $44,241 |
| Samoans | 4.2 /100 | #241 | Tragic $44,206 |
| Immigrants | Venezuela | 4.0 /100 | #242 | Tragic $44,163 |
| Sub-Saharan Africans | 3.7 /100 | #243 | Tragic $44,118 |
Demographics Similar to Basques by Median Earnings
In terms of median earnings, the demographic groups most similar to Basques are Danish ($46,392, a difference of 0.020%), Belgian ($46,375, a difference of 0.050%), Scandinavian ($46,433, a difference of 0.070%), Ghanaian ($46,440, a difference of 0.090%), and Colombian ($46,349, a difference of 0.11%).
| Demographics | Rating | Rank | Median Earnings |
| Immigrants | Africa | 54.6 /100 | #168 | Average $46,564 |
| Immigrants | South America | 54.0 /100 | #169 | Average $46,548 |
| Immigrants | Immigrants | 51.6 /100 | #170 | Average $46,478 |
| Scottish | 51.1 /100 | #171 | Average $46,463 |
| Kenyans | 51.0 /100 | #172 | Average $46,462 |
| Ghanaians | 50.3 /100 | #173 | Average $46,440 |
| Scandinavians | 50.0 /100 | #174 | Average $46,433 |
| Basques | 48.8 /100 | #175 | Average $46,399 |
| Danes | 48.6 /100 | #176 | Average $46,392 |
| Belgians | 48.0 /100 | #177 | Average $46,375 |
| Colombians | 47.1 /100 | #178 | Average $46,349 |
| English | 46.5 /100 | #179 | Average $46,334 |
| Puget Sound Salish | 46.5 /100 | #180 | Average $46,333 |
| Immigrants | Cameroon | 46.4 /100 | #181 | Average $46,329 |
| Swiss | 45.9 /100 | #182 | Average $46,315 |