Immigrants from Liberia vs Basque Median Family Income
COMPARE
Immigrants from Liberia
Basque
Median Family Income
Median Family Income Comparison
Immigrants from Liberia
Basques
$90,450
MEDIAN FAMILY INCOME
0.2/ 100
METRIC RATING
272nd/ 347
METRIC RANK
$104,760
MEDIAN FAMILY INCOME
74.4/ 100
METRIC RATING
156th/ 347
METRIC RANK
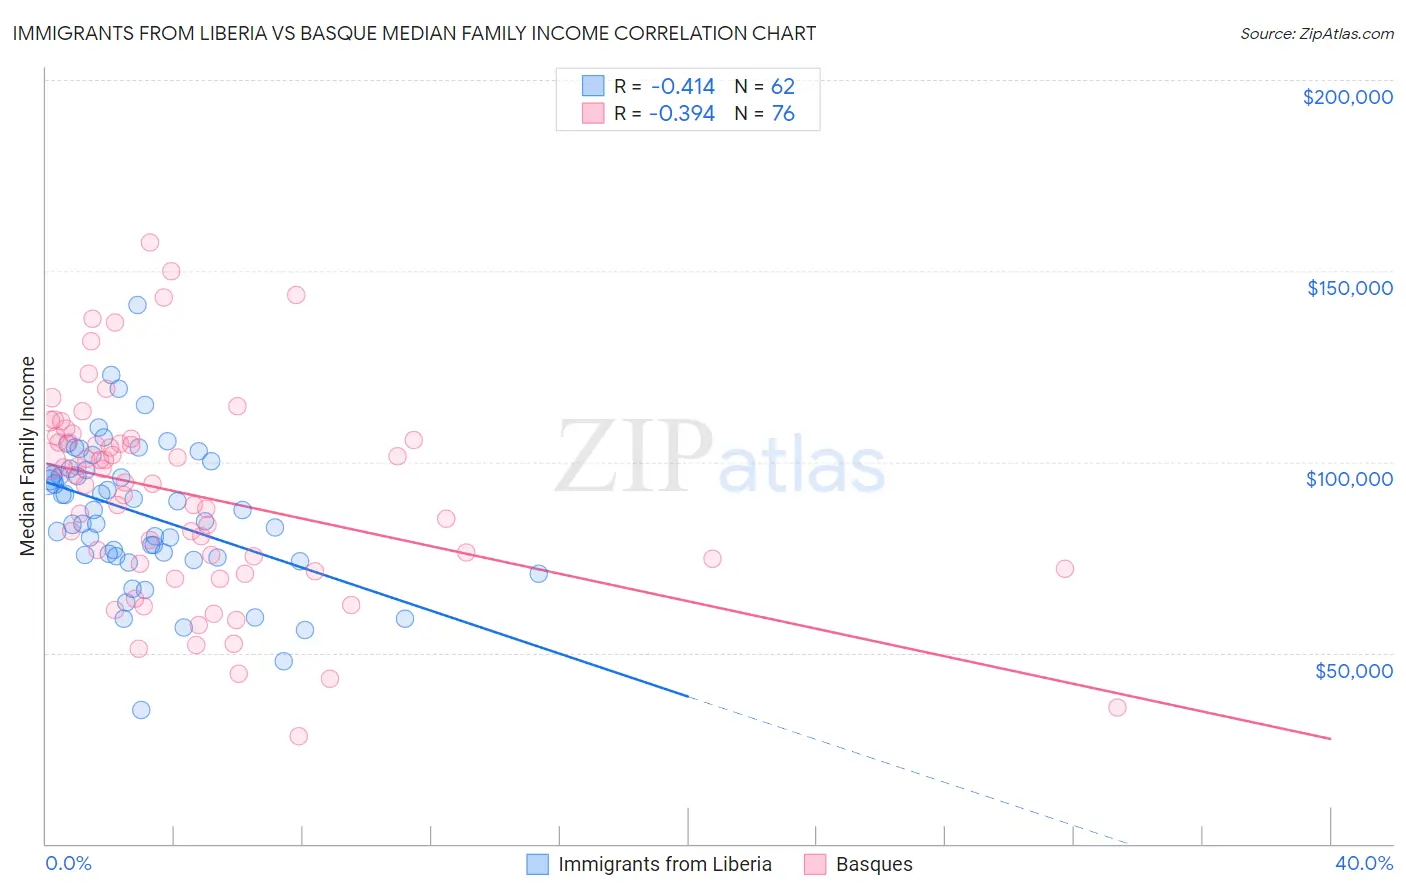
Immigrants from Liberia vs Basque Median Family Income Correlation Chart
The statistical analysis conducted on geographies consisting of 135,228,267 people shows a moderate negative correlation between the proportion of Immigrants from Liberia and median family income in the United States with a correlation coefficient (R) of -0.414 and weighted average of $90,450. Similarly, the statistical analysis conducted on geographies consisting of 165,742,125 people shows a mild negative correlation between the proportion of Basques and median family income in the United States with a correlation coefficient (R) of -0.394 and weighted average of $104,760, a difference of 15.8%.
Median Family Income Correlation Summary
| Measurement | Immigrants from Liberia | Basque |
| Minimum | $34,978 | $28,036 |
| Maximum | $141,080 | $157,351 |
| Range | $106,102 | $129,315 |
| Mean | $86,151 | $91,256 |
| Median | $85,817 | $94,457 |
| Interquartile 25% (IQ1) | $75,284 | $72,725 |
| Interquartile 75% (IQ3) | $97,769 | $105,919 |
| Interquartile Range (IQR) | $22,485 | $33,194 |
| Standard Deviation (Sample) | $18,837 | $26,783 |
| Standard Deviation (Population) | $18,685 | $26,606 |
Similar Demographics by Median Family Income
Demographics Similar to Immigrants from Liberia by Median Family Income
In terms of median family income, the demographic groups most similar to Immigrants from Liberia are Iroquois ($90,543, a difference of 0.10%), Immigrants from Micronesia ($90,345, a difference of 0.12%), Jamaican ($90,581, a difference of 0.14%), Spanish American ($90,322, a difference of 0.14%), and Immigrants from St. Vincent and the Grenadines ($90,094, a difference of 0.40%).
| Demographics | Rating | Rank | Median Family Income |
| Hmong | 0.3 /100 | #265 | Tragic $91,296 |
| Central Americans | 0.3 /100 | #266 | Tragic $91,087 |
| Mexican American Indians | 0.2 /100 | #267 | Tragic $90,918 |
| Cree | 0.2 /100 | #268 | Tragic $90,882 |
| Belizeans | 0.2 /100 | #269 | Tragic $90,880 |
| Jamaicans | 0.2 /100 | #270 | Tragic $90,581 |
| Iroquois | 0.2 /100 | #271 | Tragic $90,543 |
| Immigrants | Liberia | 0.2 /100 | #272 | Tragic $90,450 |
| Immigrants | Micronesia | 0.2 /100 | #273 | Tragic $90,345 |
| Spanish Americans | 0.2 /100 | #274 | Tragic $90,322 |
| Immigrants | St. Vincent and the Grenadines | 0.2 /100 | #275 | Tragic $90,094 |
| Immigrants | Zaire | 0.1 /100 | #276 | Tragic $89,285 |
| Immigrants | Jamaica | 0.1 /100 | #277 | Tragic $89,268 |
| Immigrants | Grenada | 0.1 /100 | #278 | Tragic $89,249 |
| Immigrants | Belize | 0.1 /100 | #279 | Tragic $89,197 |
Demographics Similar to Basques by Median Family Income
In terms of median family income, the demographic groups most similar to Basques are Native Hawaiian ($104,910, a difference of 0.14%), Immigrants from Nepal ($104,966, a difference of 0.20%), Moroccan ($104,488, a difference of 0.26%), Scandinavian ($104,410, a difference of 0.34%), and Swiss ($104,396, a difference of 0.35%).
| Demographics | Rating | Rank | Median Family Income |
| Immigrants | Germany | 80.9 /100 | #149 | Excellent $105,507 |
| Irish | 80.5 /100 | #150 | Excellent $105,453 |
| Peruvians | 80.4 /100 | #151 | Excellent $105,444 |
| Immigrants | Albania | 79.1 /100 | #152 | Good $105,285 |
| Slavs | 77.9 /100 | #153 | Good $105,144 |
| Immigrants | Nepal | 76.3 /100 | #154 | Good $104,966 |
| Native Hawaiians | 75.8 /100 | #155 | Good $104,910 |
| Basques | 74.4 /100 | #156 | Good $104,760 |
| Moroccans | 71.6 /100 | #157 | Good $104,488 |
| Scandinavians | 70.8 /100 | #158 | Good $104,410 |
| Swiss | 70.7 /100 | #159 | Good $104,396 |
| Scottish | 69.5 /100 | #160 | Good $104,288 |
| Icelanders | 69.4 /100 | #161 | Good $104,282 |
| Immigrants | Sierra Leone | 66.2 /100 | #162 | Good $103,990 |
| Costa Ricans | 66.2 /100 | #163 | Good $103,989 |