Immigrants from Iran vs Norwegian Median Earnings
COMPARE
Immigrants from Iran
Norwegian
Median Earnings
Median Earnings Comparison
Immigrants from Iran
Norwegians
$57,612
MEDIAN EARNINGS
100.0/ 100
METRIC RATING
8th/ 347
METRIC RANK
$46,865
MEDIAN EARNINGS
64.7/ 100
METRIC RATING
164th/ 347
METRIC RANK
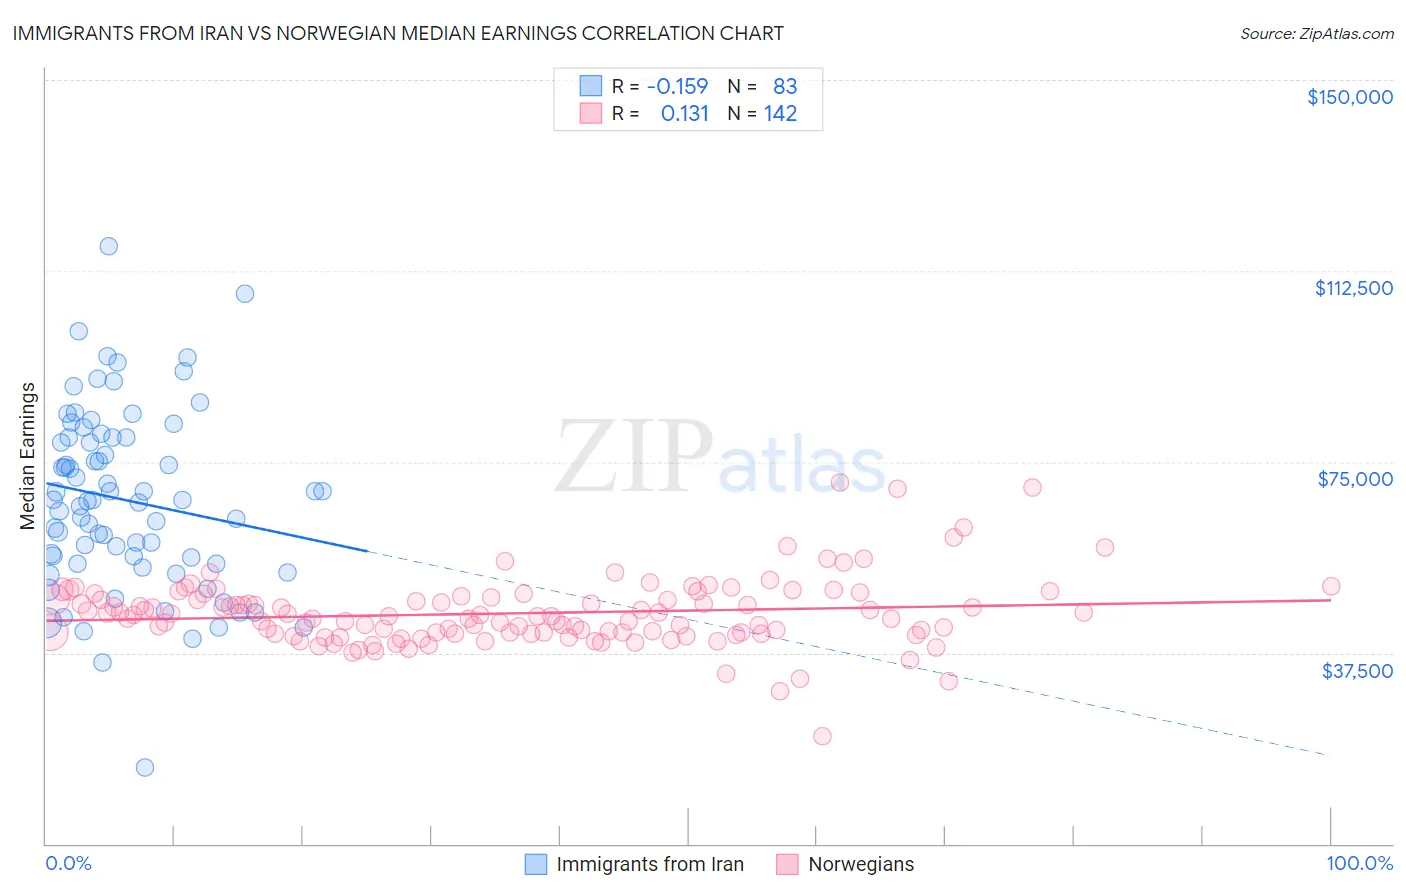
Immigrants from Iran vs Norwegian Median Earnings Correlation Chart
The statistical analysis conducted on geographies consisting of 279,892,133 people shows a poor negative correlation between the proportion of Immigrants from Iran and median earnings in the United States with a correlation coefficient (R) of -0.159 and weighted average of $57,612. Similarly, the statistical analysis conducted on geographies consisting of 533,161,956 people shows a poor positive correlation between the proportion of Norwegians and median earnings in the United States with a correlation coefficient (R) of 0.131 and weighted average of $46,865, a difference of 22.9%.
Median Earnings Correlation Summary
| Measurement | Immigrants from Iran | Norwegian |
| Minimum | $14,861 | $21,029 |
| Maximum | $117,429 | $70,965 |
| Range | $102,568 | $49,936 |
| Mean | $67,470 | $45,261 |
| Median | $67,500 | $44,720 |
| Interquartile 25% (IQ1) | $54,982 | $41,272 |
| Interquartile 75% (IQ3) | $79,813 | $48,283 |
| Interquartile Range (IQR) | $24,831 | $7,011 |
| Standard Deviation (Sample) | $17,753 | $6,752 |
| Standard Deviation (Population) | $17,645 | $6,728 |
Similar Demographics by Median Earnings
Demographics Similar to Immigrants from Iran by Median Earnings
In terms of median earnings, the demographic groups most similar to Immigrants from Iran are Okinawan ($57,550, a difference of 0.11%), Immigrants from South Central Asia ($57,114, a difference of 0.87%), Immigrants from Israel ($57,034, a difference of 1.0%), Immigrants from Ireland ($56,854, a difference of 1.3%), and Iranian ($58,474, a difference of 1.5%).
| Demographics | Rating | Rank | Median Earnings |
| Filipinos | 100.0 /100 | #1 | Exceptional $61,197 |
| Immigrants | Taiwan | 100.0 /100 | #2 | Exceptional $61,151 |
| Immigrants | India | 100.0 /100 | #3 | Exceptional $60,648 |
| Immigrants | Hong Kong | 100.0 /100 | #4 | Exceptional $59,433 |
| Thais | 100.0 /100 | #5 | Exceptional $59,237 |
| Immigrants | Singapore | 100.0 /100 | #6 | Exceptional $59,038 |
| Iranians | 100.0 /100 | #7 | Exceptional $58,474 |
| Immigrants | Iran | 100.0 /100 | #8 | Exceptional $57,612 |
| Okinawans | 100.0 /100 | #9 | Exceptional $57,550 |
| Immigrants | South Central Asia | 100.0 /100 | #10 | Exceptional $57,114 |
| Immigrants | Israel | 100.0 /100 | #11 | Exceptional $57,034 |
| Immigrants | Ireland | 100.0 /100 | #12 | Exceptional $56,854 |
| Immigrants | China | 100.0 /100 | #13 | Exceptional $56,638 |
| Immigrants | Australia | 100.0 /100 | #14 | Exceptional $56,305 |
| Indians (Asian) | 100.0 /100 | #15 | Exceptional $56,253 |
Demographics Similar to Norwegians by Median Earnings
In terms of median earnings, the demographic groups most similar to Norwegians are Icelander ($46,916, a difference of 0.11%), South American ($46,804, a difference of 0.13%), South American Indian ($46,952, a difference of 0.18%), Immigrants from Eastern Africa ($46,969, a difference of 0.22%), and Immigrants from Peru ($47,025, a difference of 0.34%).
| Demographics | Rating | Rank | Median Earnings |
| Czechs | 75.1 /100 | #157 | Good $47,221 |
| Slovaks | 71.7 /100 | #158 | Good $47,095 |
| Immigrants | Peru | 69.6 /100 | #159 | Good $47,025 |
| Alsatians | 69.6 /100 | #160 | Good $47,023 |
| Immigrants | Eastern Africa | 68.0 /100 | #161 | Good $46,969 |
| South American Indians | 67.4 /100 | #162 | Good $46,952 |
| Icelanders | 66.3 /100 | #163 | Good $46,916 |
| Norwegians | 64.7 /100 | #164 | Good $46,865 |
| South Americans | 62.7 /100 | #165 | Good $46,804 |
| Czechoslovakians | 57.8 /100 | #166 | Average $46,658 |
| Costa Ricans | 57.4 /100 | #167 | Average $46,645 |
| Immigrants | Africa | 54.6 /100 | #168 | Average $46,564 |
| Immigrants | South America | 54.0 /100 | #169 | Average $46,548 |
| Immigrants | Immigrants | 51.6 /100 | #170 | Average $46,478 |
| Scottish | 51.1 /100 | #171 | Average $46,463 |