Immigrants from Latvia vs Norwegian Kindergarten
COMPARE
Immigrants from Latvia
Norwegian
Kindergarten
Kindergarten Comparison
Immigrants from Latvia
Norwegians
98.2%
KINDERGARTEN
96.3/ 100
METRIC RATING
113th/ 347
METRIC RANK
98.7%
KINDERGARTEN
100.0/ 100
METRIC RATING
8th/ 347
METRIC RANK
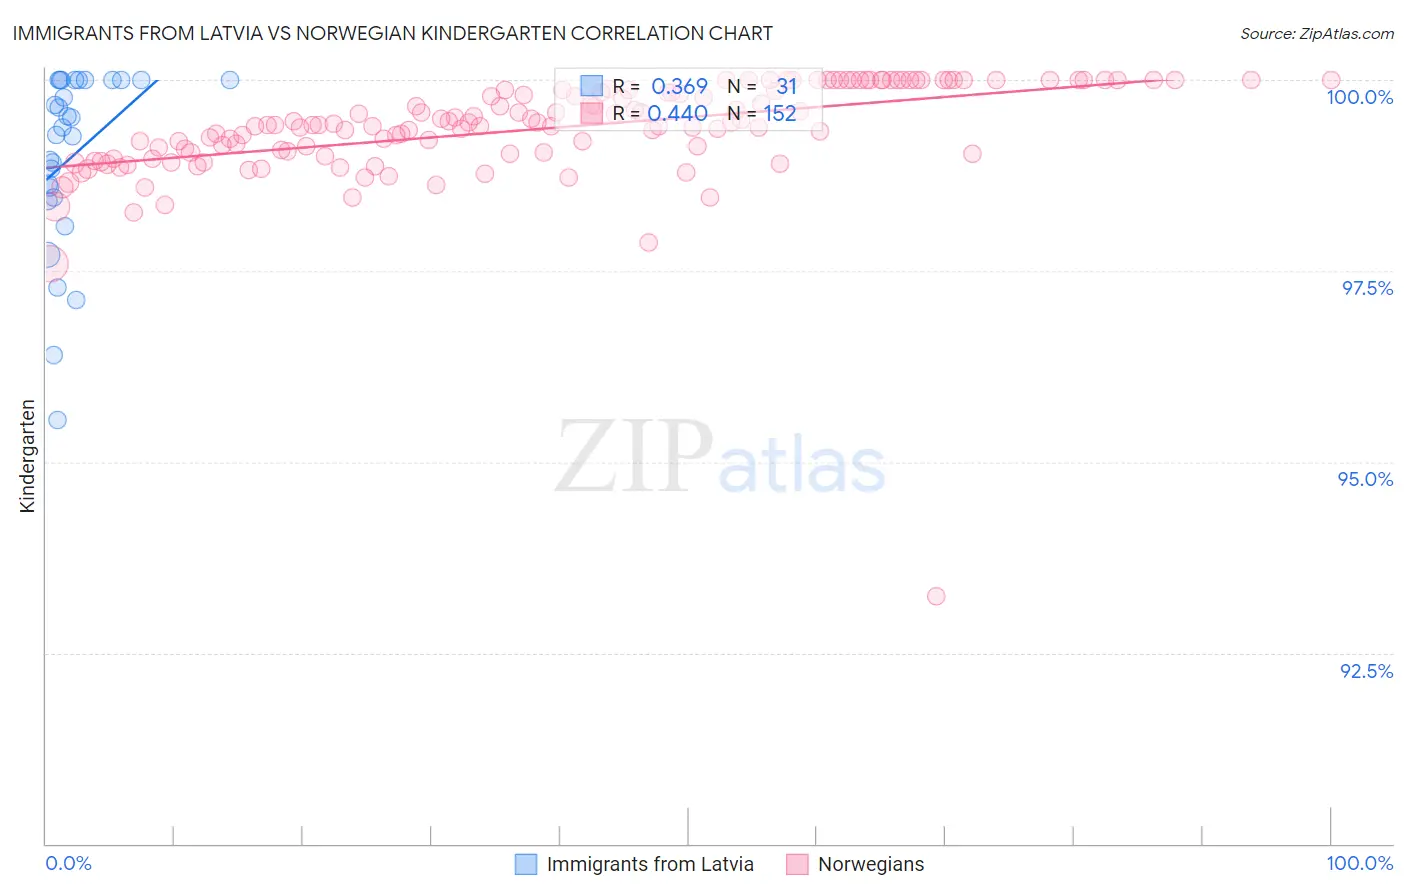
Immigrants from Latvia vs Norwegian Kindergarten Correlation Chart
The statistical analysis conducted on geographies consisting of 113,735,345 people shows a mild positive correlation between the proportion of Immigrants from Latvia and percentage of population with at least kindergarten education in the United States with a correlation coefficient (R) of 0.369 and weighted average of 98.2%. Similarly, the statistical analysis conducted on geographies consisting of 533,395,488 people shows a moderate positive correlation between the proportion of Norwegians and percentage of population with at least kindergarten education in the United States with a correlation coefficient (R) of 0.440 and weighted average of 98.7%, a difference of 0.53%.
Kindergarten Correlation Summary
| Measurement | Immigrants from Latvia | Norwegian |
| Minimum | 95.5% | 93.2% |
| Maximum | 100.0% | 100.0% |
| Range | 4.5% | 6.8% |
| Mean | 99.0% | 99.4% |
| Median | 99.4% | 99.4% |
| Interquartile 25% (IQ1) | 98.5% | 99.0% |
| Interquartile 75% (IQ3) | 100.0% | 99.9% |
| Interquartile Range (IQR) | 1.5% | 0.83% |
| Standard Deviation (Sample) | 1.2% | 0.71% |
| Standard Deviation (Population) | 1.1% | 0.71% |
Similar Demographics by Kindergarten
Demographics Similar to Immigrants from Latvia by Kindergarten
In terms of kindergarten, the demographic groups most similar to Immigrants from Latvia are Ute (98.2%, a difference of 0.0%), Iranian (98.2%, a difference of 0.0%), Immigrants from Singapore (98.2%, a difference of 0.010%), Immigrants from Norway (98.2%, a difference of 0.010%), and Immigrants from Czechoslovakia (98.2%, a difference of 0.010%).
| Demographics | Rating | Rank | Kindergarten |
| Basques | 97.3 /100 | #106 | Exceptional 98.2% |
| Turks | 97.3 /100 | #107 | Exceptional 98.2% |
| Immigrants | Switzerland | 97.2 /100 | #108 | Exceptional 98.2% |
| German Russians | 97.1 /100 | #109 | Exceptional 98.2% |
| Immigrants | Singapore | 96.8 /100 | #110 | Exceptional 98.2% |
| Immigrants | Norway | 96.6 /100 | #111 | Exceptional 98.2% |
| Immigrants | Czechoslovakia | 96.6 /100 | #112 | Exceptional 98.2% |
| Immigrants | Latvia | 96.3 /100 | #113 | Exceptional 98.2% |
| Ute | 96.3 /100 | #114 | Exceptional 98.2% |
| Iranians | 96.2 /100 | #115 | Exceptional 98.2% |
| Spanish | 95.8 /100 | #116 | Exceptional 98.2% |
| Immigrants | France | 95.5 /100 | #117 | Exceptional 98.2% |
| Yugoslavians | 95.5 /100 | #118 | Exceptional 98.2% |
| Thais | 94.8 /100 | #119 | Exceptional 98.2% |
| Okinawans | 94.4 /100 | #120 | Exceptional 98.2% |
Demographics Similar to Norwegians by Kindergarten
In terms of kindergarten, the demographic groups most similar to Norwegians are Tlingit-Haida (98.7%, a difference of 0.010%), Alaska Native (98.7%, a difference of 0.020%), Slovak (98.7%, a difference of 0.020%), German (98.7%, a difference of 0.020%), and Slovene (98.7%, a difference of 0.040%).
| Demographics | Rating | Rank | Kindergarten |
| Crow | 100.0 /100 | #1 | Exceptional 99.7% |
| Yup'ik | 100.0 /100 | #2 | Exceptional 99.2% |
| Inupiat | 100.0 /100 | #3 | Exceptional 98.9% |
| Welsh | 100.0 /100 | #4 | Exceptional 98.9% |
| Tsimshian | 100.0 /100 | #5 | Exceptional 98.8% |
| Alaskan Athabascans | 100.0 /100 | #6 | Exceptional 98.8% |
| Alaska Natives | 100.0 /100 | #7 | Exceptional 98.7% |
| Norwegians | 100.0 /100 | #8 | Exceptional 98.7% |
| Tlingit-Haida | 100.0 /100 | #9 | Exceptional 98.7% |
| Slovaks | 100.0 /100 | #10 | Exceptional 98.7% |
| Germans | 100.0 /100 | #11 | Exceptional 98.7% |
| Slovenes | 100.0 /100 | #12 | Exceptional 98.7% |
| Carpatho Rusyns | 100.0 /100 | #13 | Exceptional 98.7% |
| English | 100.0 /100 | #14 | Exceptional 98.7% |
| Swedes | 100.0 /100 | #15 | Exceptional 98.7% |