Immigrants from Latvia vs Norwegian Disability Age 5 to 17
COMPARE
Immigrants from Latvia
Norwegian
Disability Age 5 to 17
Disability Age 5 to 17 Comparison
Immigrants from Latvia
Norwegians
5.3%
DISABILITY AGE 5 TO 17
97.9/ 100
METRIC RATING
112th/ 347
METRIC RANK
5.7%
DISABILITY AGE 5 TO 17
20.9/ 100
METRIC RATING
198th/ 347
METRIC RANK
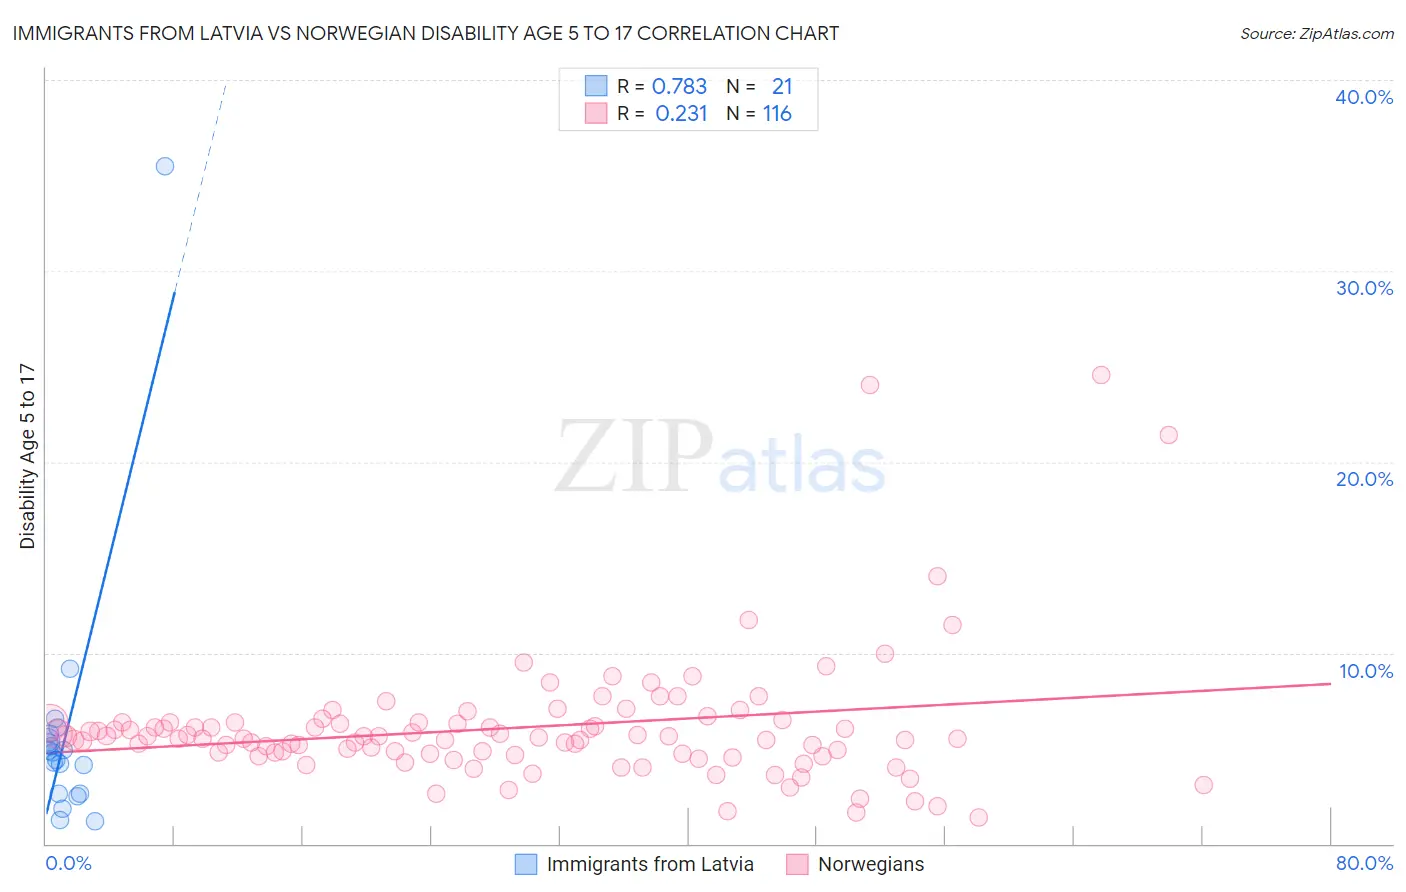
Immigrants from Latvia vs Norwegian Disability Age 5 to 17 Correlation Chart
The statistical analysis conducted on geographies consisting of 113,351,045 people shows a strong positive correlation between the proportion of Immigrants from Latvia and percentage of population with a disability between the ages 5 and 17 in the United States with a correlation coefficient (R) of 0.783 and weighted average of 5.3%. Similarly, the statistical analysis conducted on geographies consisting of 523,039,839 people shows a weak positive correlation between the proportion of Norwegians and percentage of population with a disability between the ages 5 and 17 in the United States with a correlation coefficient (R) of 0.231 and weighted average of 5.7%, a difference of 6.7%.
Disability Age 5 to 17 Correlation Summary
| Measurement | Immigrants from Latvia | Norwegian |
| Minimum | 1.2% | 1.4% |
| Maximum | 35.5% | 24.5% |
| Range | 34.4% | 23.2% |
| Mean | 5.8% | 6.1% |
| Median | 4.8% | 5.5% |
| Interquartile 25% (IQ1) | 2.6% | 4.7% |
| Interquartile 75% (IQ3) | 5.6% | 6.3% |
| Interquartile Range (IQR) | 2.9% | 1.6% |
| Standard Deviation (Sample) | 7.1% | 3.4% |
| Standard Deviation (Population) | 6.9% | 3.4% |
Similar Demographics by Disability Age 5 to 17
Demographics Similar to Immigrants from Latvia by Disability Age 5 to 17
In terms of disability age 5 to 17, the demographic groups most similar to Immigrants from Latvia are Ethiopian (5.3%, a difference of 0.020%), Aleut (5.3%, a difference of 0.040%), Immigrants from Eritrea (5.3%, a difference of 0.050%), Immigrants from Northern Europe (5.3%, a difference of 0.070%), and Cuban (5.3%, a difference of 0.080%).
| Demographics | Rating | Rank | Disability Age 5 to 17 |
| Immigrants | Italy | 98.4 /100 | #105 | Exceptional 5.3% |
| Immigrants | Yemen | 98.2 /100 | #106 | Exceptional 5.3% |
| Russians | 98.2 /100 | #107 | Exceptional 5.3% |
| Immigrants | South Africa | 98.1 /100 | #108 | Exceptional 5.3% |
| Immigrants | Northern Africa | 98.1 /100 | #109 | Exceptional 5.3% |
| Immigrants | Eritrea | 98.0 /100 | #110 | Exceptional 5.3% |
| Ethiopians | 97.9 /100 | #111 | Exceptional 5.3% |
| Immigrants | Latvia | 97.9 /100 | #112 | Exceptional 5.3% |
| Aleuts | 97.8 /100 | #113 | Exceptional 5.3% |
| Immigrants | Northern Europe | 97.8 /100 | #114 | Exceptional 5.3% |
| Cubans | 97.8 /100 | #115 | Exceptional 5.3% |
| Cypriots | 97.7 /100 | #116 | Exceptional 5.3% |
| Immigrants | Afghanistan | 97.4 /100 | #117 | Exceptional 5.3% |
| South Americans | 97.1 /100 | #118 | Exceptional 5.4% |
| Immigrants | South America | 97.1 /100 | #119 | Exceptional 5.4% |
Demographics Similar to Norwegians by Disability Age 5 to 17
In terms of disability age 5 to 17, the demographic groups most similar to Norwegians are Immigrants from North America (5.7%, a difference of 0.16%), Inupiat (5.7%, a difference of 0.17%), Immigrants from Nigeria (5.7%, a difference of 0.18%), Croatian (5.7%, a difference of 0.19%), and Immigrants from Canada (5.7%, a difference of 0.35%).
| Demographics | Rating | Rank | Disability Age 5 to 17 |
| Danes | 26.5 /100 | #191 | Fair 5.7% |
| Immigrants | Bosnia and Herzegovina | 26.3 /100 | #192 | Fair 5.7% |
| Immigrants | Canada | 26.1 /100 | #193 | Fair 5.7% |
| Croatians | 23.6 /100 | #194 | Fair 5.7% |
| Immigrants | Nigeria | 23.4 /100 | #195 | Fair 5.7% |
| Inupiat | 23.3 /100 | #196 | Fair 5.7% |
| Immigrants | North America | 23.1 /100 | #197 | Fair 5.7% |
| Norwegians | 20.9 /100 | #198 | Fair 5.7% |
| Northern Europeans | 15.2 /100 | #199 | Poor 5.7% |
| Icelanders | 14.6 /100 | #200 | Poor 5.7% |
| Basques | 13.7 /100 | #201 | Poor 5.7% |
| Austrians | 13.2 /100 | #202 | Poor 5.7% |
| Spanish American Indians | 12.8 /100 | #203 | Poor 5.7% |
| Paiute | 11.2 /100 | #204 | Poor 5.7% |
| Trinidadians and Tobagonians | 10.8 /100 | #205 | Poor 5.7% |