Cajun vs Immigrants from Kenya Wage/Income Gap
COMPARE
Cajun
Immigrants from Kenya
Wage/Income Gap
Wage/Income Gap Comparison
Cajuns
Immigrants from Kenya
33.9%
WAGE/INCOME GAP
0.0/ 100
METRIC RATING
346th/ 347
METRIC RANK
24.4%
WAGE/INCOME GAP
96.4/ 100
METRIC RATING
115th/ 347
METRIC RANK
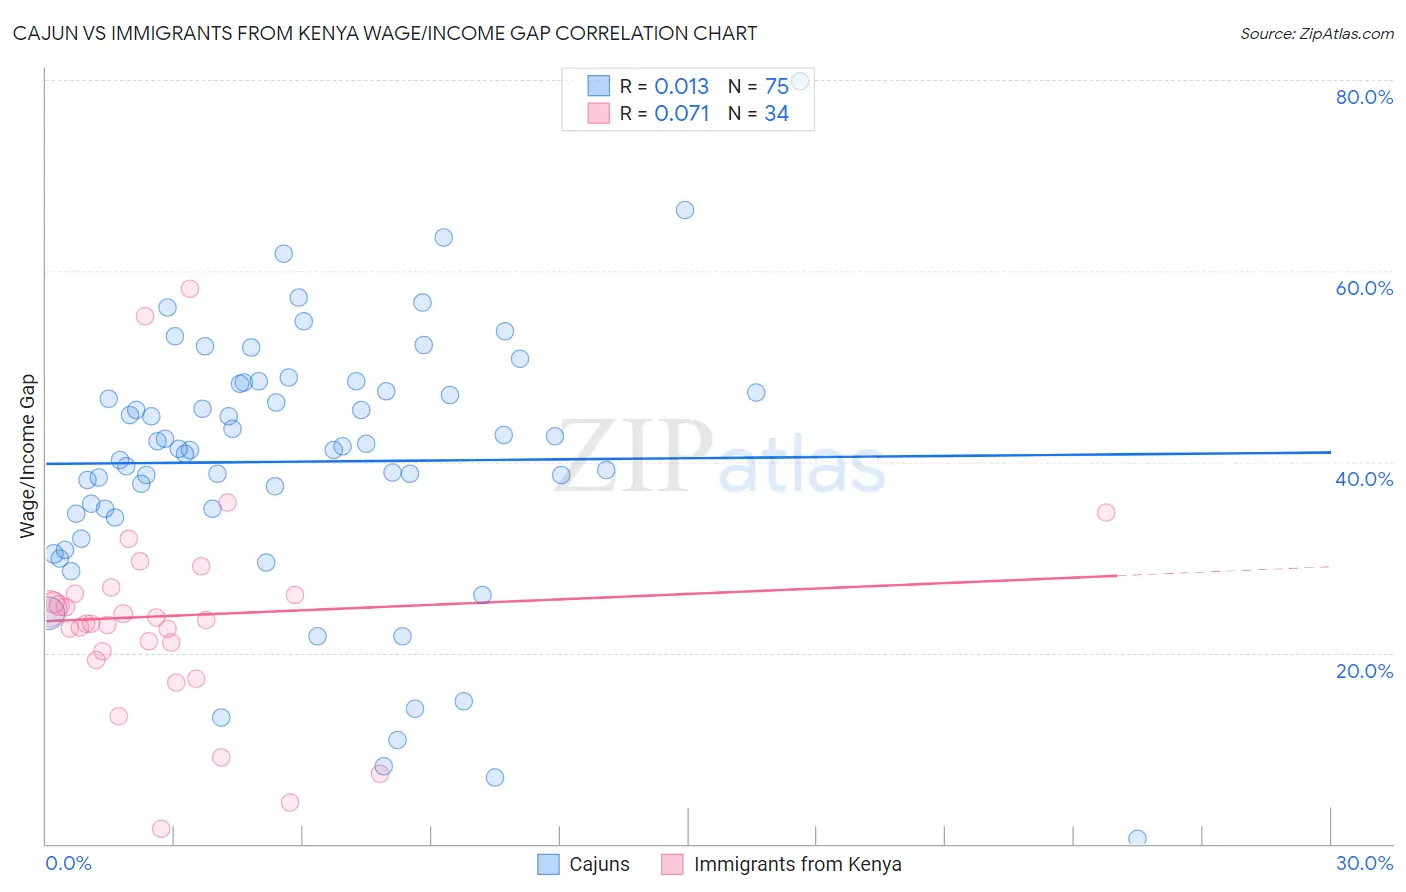
Cajun vs Immigrants from Kenya Wage/Income Gap Correlation Chart
The statistical analysis conducted on geographies consisting of 149,601,771 people shows no correlation between the proportion of Cajuns and wage/income gap percentage in the United States with a correlation coefficient (R) of 0.013 and weighted average of 33.9%. Similarly, the statistical analysis conducted on geographies consisting of 218,055,020 people shows a slight positive correlation between the proportion of Immigrants from Kenya and wage/income gap percentage in the United States with a correlation coefficient (R) of 0.071 and weighted average of 24.4%, a difference of 38.9%.
Wage/Income Gap Correlation Summary
| Measurement | Cajun | Immigrants from Kenya |
| Minimum | 0.52% | 1.6% |
| Maximum | 79.9% | 58.2% |
| Range | 79.4% | 56.5% |
| Mean | 40.0% | 23.9% |
| Median | 41.3% | 23.2% |
| Interquartile 25% (IQ1) | 34.6% | 20.1% |
| Interquartile 75% (IQ3) | 48.1% | 26.2% |
| Interquartile Range (IQR) | 13.5% | 6.1% |
| Standard Deviation (Sample) | 14.0% | 11.3% |
| Standard Deviation (Population) | 13.9% | 11.1% |
Similar Demographics by Wage/Income Gap
Demographics Similar to Cajuns by Wage/Income Gap
In terms of wage/income gap, the demographic groups most similar to Cajuns are Immigrants from India (31.5%, a difference of 7.4%), Assyrian/Chaldean/Syriac (31.0%, a difference of 9.3%), Danish (31.0%, a difference of 9.4%), Pennsylvania German (30.7%, a difference of 10.3%), and Thai (30.5%, a difference of 11.2%).
| Demographics | Rating | Rank | Wage/Income Gap |
| Europeans | 0.0 /100 | #333 | Tragic 29.4% |
| Swedes | 0.0 /100 | #334 | Tragic 29.4% |
| Immigrants | Taiwan | 0.0 /100 | #335 | Tragic 29.5% |
| English | 0.0 /100 | #336 | Tragic 29.5% |
| Dutch | 0.0 /100 | #337 | Tragic 29.6% |
| Filipinos | 0.0 /100 | #338 | Tragic 29.7% |
| Iranians | 0.0 /100 | #339 | Tragic 29.7% |
| Swiss | 0.0 /100 | #340 | Tragic 30.0% |
| Thais | 0.0 /100 | #341 | Tragic 30.5% |
| Pennsylvania Germans | 0.0 /100 | #342 | Tragic 30.7% |
| Danes | 0.0 /100 | #343 | Tragic 31.0% |
| Assyrians/Chaldeans/Syriacs | 0.0 /100 | #344 | Tragic 31.0% |
| Immigrants | India | 0.0 /100 | #345 | Tragic 31.5% |
| Cajuns | 0.0 /100 | #346 | Tragic 33.9% |
| Houma | 0.0 /100 | #347 | Tragic 38.7% |
Demographics Similar to Immigrants from Kenya by Wage/Income Gap
In terms of wage/income gap, the demographic groups most similar to Immigrants from Kenya are Panamanian (24.4%, a difference of 0.060%), Alaska Native (24.4%, a difference of 0.17%), Immigrants from Afghanistan (24.4%, a difference of 0.23%), Sioux (24.3%, a difference of 0.26%), and Immigrants from Micronesia (24.4%, a difference of 0.26%).
| Demographics | Rating | Rank | Wage/Income Gap |
| Immigrants | Albania | 98.4 /100 | #108 | Exceptional 24.0% |
| Ugandans | 98.3 /100 | #109 | Exceptional 24.1% |
| Immigrants | Morocco | 98.1 /100 | #110 | Exceptional 24.1% |
| Soviet Union | 97.6 /100 | #111 | Exceptional 24.2% |
| Immigrants | Colombia | 97.0 /100 | #112 | Exceptional 24.3% |
| Sioux | 96.9 /100 | #113 | Exceptional 24.3% |
| Panamanians | 96.5 /100 | #114 | Exceptional 24.4% |
| Immigrants | Kenya | 96.4 /100 | #115 | Exceptional 24.4% |
| Alaska Natives | 96.0 /100 | #116 | Exceptional 24.4% |
| Immigrants | Afghanistan | 95.9 /100 | #117 | Exceptional 24.4% |
| Immigrants | Micronesia | 95.8 /100 | #118 | Exceptional 24.4% |
| Kenyans | 95.8 /100 | #119 | Exceptional 24.5% |
| Cree | 95.6 /100 | #120 | Exceptional 24.5% |
| Immigrants | Thailand | 94.9 /100 | #121 | Exceptional 24.5% |
| Apache | 94.8 /100 | #122 | Exceptional 24.5% |