Immigrants from Latvia vs Immigrants from Kenya Married-couple Households
COMPARE
Immigrants from Latvia
Immigrants from Kenya
Married-couple Households
Married-couple Households Comparison
Immigrants from Latvia
Immigrants from Kenya
46.0%
MARRIED-COUPLE HOUSEHOLDS
26.9/ 100
METRIC RATING
189th/ 347
METRIC RANK
44.1%
MARRIED-COUPLE HOUSEHOLDS
0.4/ 100
METRIC RATING
249th/ 347
METRIC RANK
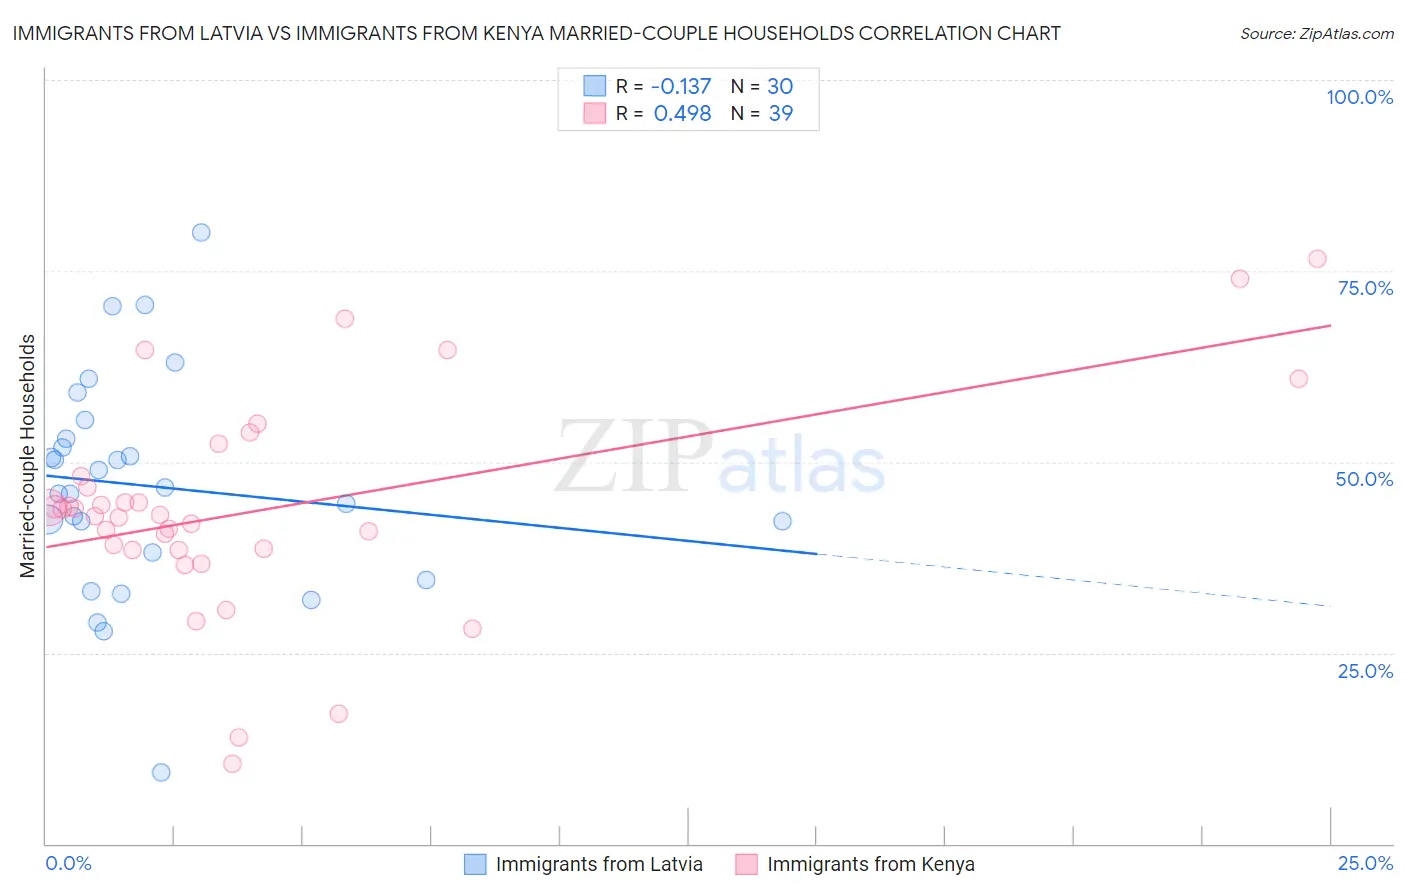
Immigrants from Latvia vs Immigrants from Kenya Married-couple Households Correlation Chart
The statistical analysis conducted on geographies consisting of 113,732,502 people shows a poor negative correlation between the proportion of Immigrants from Latvia and percentage of married-couple family households in the United States with a correlation coefficient (R) of -0.137 and weighted average of 46.0%. Similarly, the statistical analysis conducted on geographies consisting of 217,996,178 people shows a moderate positive correlation between the proportion of Immigrants from Kenya and percentage of married-couple family households in the United States with a correlation coefficient (R) of 0.498 and weighted average of 44.1%, a difference of 4.4%.
Married-couple Households Correlation Summary
| Measurement | Immigrants from Latvia | Immigrants from Kenya |
| Minimum | 9.2% | 10.5% |
| Maximum | 80.0% | 76.7% |
| Range | 70.8% | 66.2% |
| Mean | 46.8% | 43.9% |
| Median | 46.2% | 43.1% |
| Interquartile 25% (IQ1) | 38.2% | 38.5% |
| Interquartile 75% (IQ3) | 53.0% | 48.1% |
| Interquartile Range (IQR) | 14.8% | 9.6% |
| Standard Deviation (Sample) | 14.4% | 14.3% |
| Standard Deviation (Population) | 14.2% | 14.1% |
Similar Demographics by Married-couple Households
Demographics Similar to Immigrants from Latvia by Married-couple Households
In terms of married-couple households, the demographic groups most similar to Immigrants from Latvia are Immigrants from Kuwait (46.0%, a difference of 0.060%), South American Indian (46.0%, a difference of 0.070%), Choctaw (46.0%, a difference of 0.10%), Fijian (46.1%, a difference of 0.11%), and Immigrants from Northern Africa (46.0%, a difference of 0.11%).
| Demographics | Rating | Rank | Married-couple Households |
| Yugoslavians | 38.9 /100 | #182 | Fair 46.2% |
| Immigrants | Brazil | 38.3 /100 | #183 | Fair 46.2% |
| Immigrants | Switzerland | 36.9 /100 | #184 | Fair 46.2% |
| Brazilians | 35.9 /100 | #185 | Fair 46.2% |
| Albanians | 31.1 /100 | #186 | Fair 46.1% |
| Fijians | 29.2 /100 | #187 | Fair 46.1% |
| South American Indians | 28.4 /100 | #188 | Fair 46.0% |
| Immigrants | Latvia | 26.9 /100 | #189 | Fair 46.0% |
| Immigrants | Kuwait | 25.6 /100 | #190 | Fair 46.0% |
| Choctaw | 24.9 /100 | #191 | Fair 46.0% |
| Immigrants | Northern Africa | 24.6 /100 | #192 | Fair 46.0% |
| Taiwanese | 23.4 /100 | #193 | Fair 45.9% |
| Mexican American Indians | 23.3 /100 | #194 | Fair 45.9% |
| Chickasaw | 22.7 /100 | #195 | Fair 45.9% |
| Immigrants | South America | 22.2 /100 | #196 | Fair 45.9% |
Demographics Similar to Immigrants from Kenya by Married-couple Households
In terms of married-couple households, the demographic groups most similar to Immigrants from Kenya are French American Indian (44.1%, a difference of 0.010%), Yup'ik (44.1%, a difference of 0.050%), German Russian (44.0%, a difference of 0.090%), Seminole (44.0%, a difference of 0.16%), and Central American (43.9%, a difference of 0.28%).
| Demographics | Rating | Rank | Married-couple Households |
| Immigrants | Albania | 1.0 /100 | #242 | Tragic 44.4% |
| Immigrants | Saudi Arabia | 0.9 /100 | #243 | Tragic 44.4% |
| Immigrants | Armenia | 0.7 /100 | #244 | Tragic 44.3% |
| Immigrants | El Salvador | 0.7 /100 | #245 | Tragic 44.3% |
| Immigrants | Cuba | 0.6 /100 | #246 | Tragic 44.2% |
| Immigrants | Morocco | 0.6 /100 | #247 | Tragic 44.2% |
| Yup'ik | 0.4 /100 | #248 | Tragic 44.1% |
| Immigrants | Kenya | 0.4 /100 | #249 | Tragic 44.1% |
| French American Indians | 0.4 /100 | #250 | Tragic 44.1% |
| German Russians | 0.4 /100 | #251 | Tragic 44.0% |
| Seminole | 0.4 /100 | #252 | Tragic 44.0% |
| Central Americans | 0.3 /100 | #253 | Tragic 43.9% |
| Apache | 0.3 /100 | #254 | Tragic 43.9% |
| Shoshone | 0.3 /100 | #255 | Tragic 43.9% |
| Ugandans | 0.3 /100 | #256 | Tragic 43.8% |