Yugoslavian vs Pima Median Earnings
COMPARE
Yugoslavian
Pima
Median Earnings
Median Earnings Comparison
Yugoslavians
Pima
$45,846
MEDIAN EARNINGS
30.5/ 100
METRIC RATING
196th/ 347
METRIC RANK
$38,285
MEDIAN EARNINGS
0.0/ 100
METRIC RATING
338th/ 347
METRIC RANK
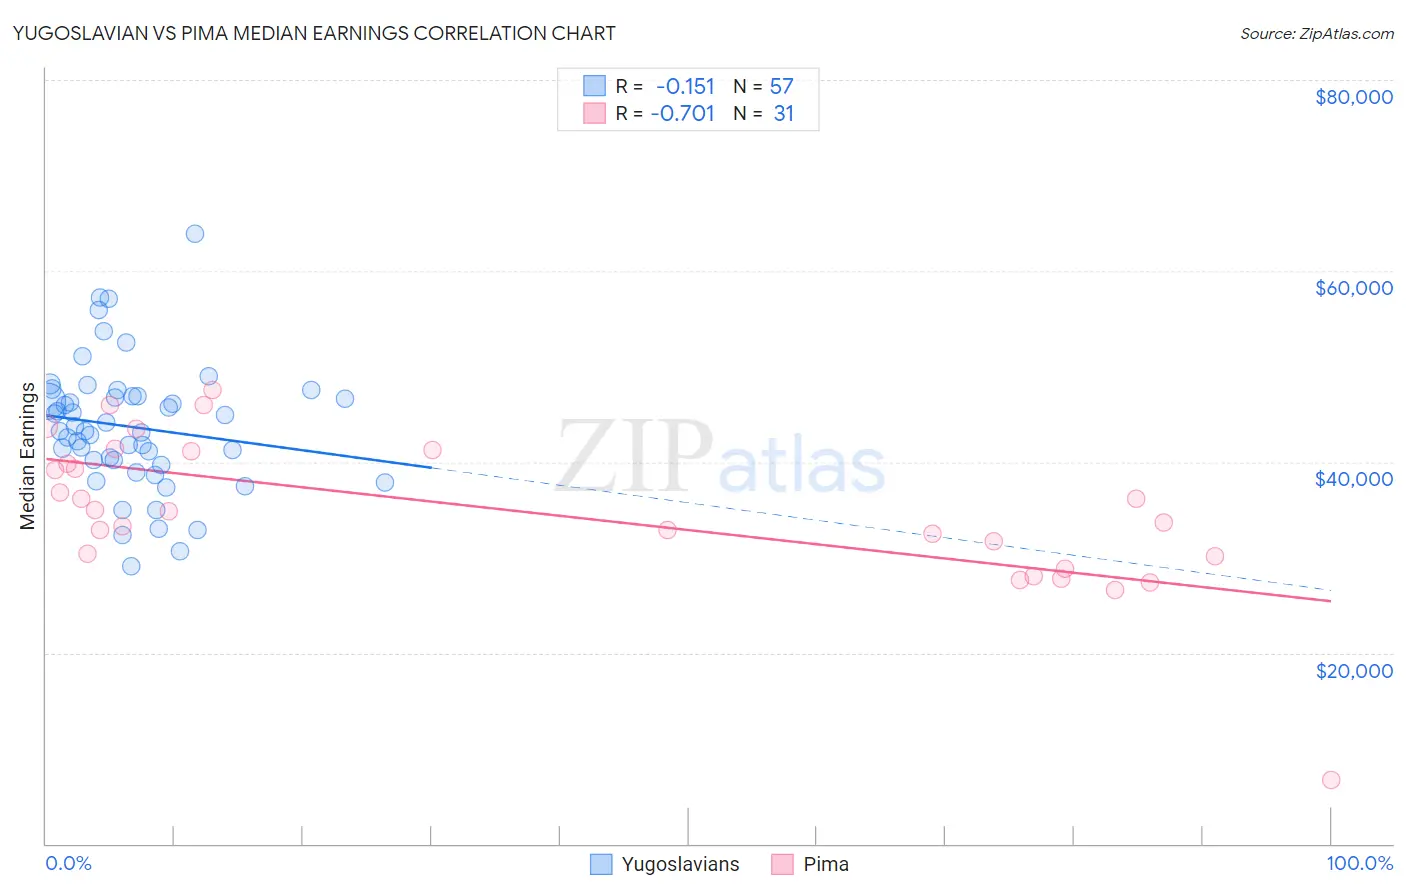
Yugoslavian vs Pima Median Earnings Correlation Chart
The statistical analysis conducted on geographies consisting of 285,700,192 people shows a poor negative correlation between the proportion of Yugoslavians and median earnings in the United States with a correlation coefficient (R) of -0.151 and weighted average of $45,846. Similarly, the statistical analysis conducted on geographies consisting of 61,551,762 people shows a strong negative correlation between the proportion of Pima and median earnings in the United States with a correlation coefficient (R) of -0.701 and weighted average of $38,285, a difference of 19.8%.
Median Earnings Correlation Summary
| Measurement | Yugoslavian | Pima |
| Minimum | $29,039 | $6,642 |
| Maximum | $63,892 | $47,578 |
| Range | $34,853 | $40,936 |
| Mean | $43,647 | $34,771 |
| Median | $43,187 | $34,844 |
| Interquartile 25% (IQ1) | $39,984 | $30,058 |
| Interquartile 75% (IQ3) | $46,857 | $41,158 |
| Interquartile Range (IQR) | $6,873 | $11,100 |
| Standard Deviation (Sample) | $6,694 | $8,029 |
| Standard Deviation (Population) | $6,635 | $7,898 |
Similar Demographics by Median Earnings
Demographics Similar to Yugoslavians by Median Earnings
In terms of median earnings, the demographic groups most similar to Yugoslavians are Barbadian ($45,846, a difference of 0.0%), Trinidadian and Tobagonian ($45,820, a difference of 0.060%), Immigrants from Barbados ($45,816, a difference of 0.070%), Immigrants from the Azores ($45,812, a difference of 0.070%), and Immigrants from St. Vincent and the Grenadines ($45,908, a difference of 0.13%).
| Demographics | Rating | Rank | Median Earnings |
| Spaniards | 37.2 /100 | #189 | Fair $46,059 |
| French Canadians | 36.1 /100 | #190 | Fair $46,026 |
| Finns | 33.4 /100 | #191 | Fair $45,940 |
| Germans | 33.2 /100 | #192 | Fair $45,935 |
| Guamanians/Chamorros | 33.2 /100 | #193 | Fair $45,933 |
| Immigrants | Costa Rica | 33.0 /100 | #194 | Fair $45,928 |
| Immigrants | St. Vincent and the Grenadines | 32.4 /100 | #195 | Fair $45,908 |
| Yugoslavians | 30.5 /100 | #196 | Fair $45,846 |
| Barbadians | 30.5 /100 | #197 | Fair $45,846 |
| Trinidadians and Tobagonians | 29.7 /100 | #198 | Fair $45,820 |
| Immigrants | Barbados | 29.6 /100 | #199 | Fair $45,816 |
| Immigrants | Azores | 29.5 /100 | #200 | Fair $45,812 |
| Celtics | 27.2 /100 | #201 | Fair $45,732 |
| Immigrants | Trinidad and Tobago | 27.1 /100 | #202 | Fair $45,729 |
| Welsh | 26.6 /100 | #203 | Fair $45,710 |
Demographics Similar to Pima by Median Earnings
In terms of median earnings, the demographic groups most similar to Pima are Immigrants from Cuba ($38,426, a difference of 0.37%), Menominee ($37,884, a difference of 1.1%), Crow ($38,707, a difference of 1.1%), Native/Alaskan ($38,896, a difference of 1.6%), and Spanish American Indian ($38,907, a difference of 1.6%).
| Demographics | Rating | Rank | Median Earnings |
| Immigrants | Mexico | 0.0 /100 | #331 | Tragic $39,114 |
| Yakama | 0.0 /100 | #332 | Tragic $39,107 |
| Houma | 0.0 /100 | #333 | Tragic $38,949 |
| Spanish American Indians | 0.0 /100 | #334 | Tragic $38,907 |
| Natives/Alaskans | 0.0 /100 | #335 | Tragic $38,896 |
| Crow | 0.0 /100 | #336 | Tragic $38,707 |
| Immigrants | Cuba | 0.0 /100 | #337 | Tragic $38,426 |
| Pima | 0.0 /100 | #338 | Tragic $38,285 |
| Menominee | 0.0 /100 | #339 | Tragic $37,884 |
| Navajo | 0.0 /100 | #340 | Tragic $36,999 |
| Lumbee | 0.0 /100 | #341 | Tragic $36,876 |
| Hopi | 0.0 /100 | #342 | Tragic $36,871 |
| Pueblo | 0.0 /100 | #343 | Tragic $36,859 |
| Arapaho | 0.0 /100 | #344 | Tragic $36,586 |
| Tohono O'odham | 0.0 /100 | #345 | Tragic $36,349 |