Estonian vs Pima Median Earnings
COMPARE
Estonian
Pima
Median Earnings
Median Earnings Comparison
Estonians
Pima
$51,772
MEDIAN EARNINGS
99.9/ 100
METRIC RATING
52nd/ 347
METRIC RANK
$38,285
MEDIAN EARNINGS
0.0/ 100
METRIC RATING
338th/ 347
METRIC RANK
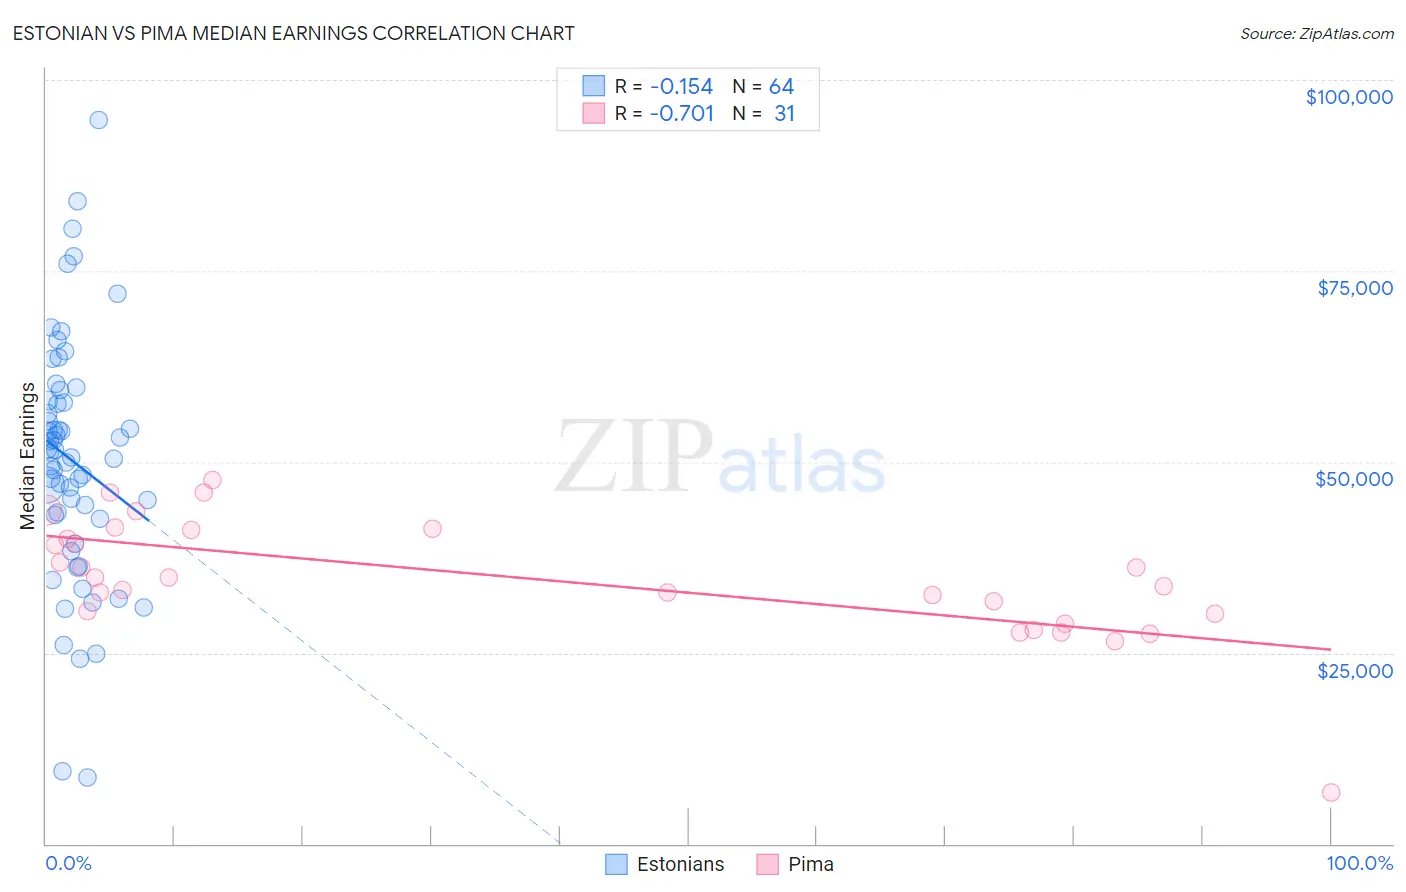
Estonian vs Pima Median Earnings Correlation Chart
The statistical analysis conducted on geographies consisting of 123,525,631 people shows a poor negative correlation between the proportion of Estonians and median earnings in the United States with a correlation coefficient (R) of -0.154 and weighted average of $51,772. Similarly, the statistical analysis conducted on geographies consisting of 61,551,762 people shows a strong negative correlation between the proportion of Pima and median earnings in the United States with a correlation coefficient (R) of -0.701 and weighted average of $38,285, a difference of 35.2%.
Median Earnings Correlation Summary
| Measurement | Estonian | Pima |
| Minimum | $8,672 | $6,642 |
| Maximum | $94,792 | $47,578 |
| Range | $86,120 | $40,936 |
| Mean | $50,194 | $34,771 |
| Median | $50,958 | $34,844 |
| Interquartile 25% (IQ1) | $42,740 | $30,058 |
| Interquartile 75% (IQ3) | $57,865 | $41,158 |
| Interquartile Range (IQR) | $15,125 | $11,100 |
| Standard Deviation (Sample) | $15,990 | $8,029 |
| Standard Deviation (Population) | $15,865 | $7,898 |
Similar Demographics by Median Earnings
Demographics Similar to Estonians by Median Earnings
In terms of median earnings, the demographic groups most similar to Estonians are Immigrants from Norway ($51,758, a difference of 0.030%), Immigrants from Austria ($51,826, a difference of 0.10%), Immigrants from Indonesia ($51,715, a difference of 0.11%), Egyptian ($51,701, a difference of 0.14%), and Immigrants from South Africa ($51,850, a difference of 0.15%).
| Demographics | Rating | Rank | Median Earnings |
| Immigrants | Czechoslovakia | 100.0 /100 | #45 | Exceptional $52,361 |
| Bhutanese | 100.0 /100 | #46 | Exceptional $52,297 |
| Australians | 100.0 /100 | #47 | Exceptional $52,294 |
| Immigrants | Europe | 100.0 /100 | #48 | Exceptional $52,195 |
| Bolivians | 100.0 /100 | #49 | Exceptional $52,005 |
| Immigrants | South Africa | 100.0 /100 | #50 | Exceptional $51,850 |
| Immigrants | Austria | 99.9 /100 | #51 | Exceptional $51,826 |
| Estonians | 99.9 /100 | #52 | Exceptional $51,772 |
| Immigrants | Norway | 99.9 /100 | #53 | Exceptional $51,758 |
| Immigrants | Indonesia | 99.9 /100 | #54 | Exceptional $51,715 |
| Egyptians | 99.9 /100 | #55 | Exceptional $51,701 |
| Immigrants | Pakistan | 99.9 /100 | #56 | Exceptional $51,693 |
| Immigrants | Eastern Europe | 99.9 /100 | #57 | Exceptional $51,624 |
| Immigrants | Bolivia | 99.9 /100 | #58 | Exceptional $51,605 |
| Immigrants | Croatia | 99.9 /100 | #59 | Exceptional $51,581 |
Demographics Similar to Pima by Median Earnings
In terms of median earnings, the demographic groups most similar to Pima are Immigrants from Cuba ($38,426, a difference of 0.37%), Menominee ($37,884, a difference of 1.1%), Crow ($38,707, a difference of 1.1%), Native/Alaskan ($38,896, a difference of 1.6%), and Spanish American Indian ($38,907, a difference of 1.6%).
| Demographics | Rating | Rank | Median Earnings |
| Immigrants | Mexico | 0.0 /100 | #331 | Tragic $39,114 |
| Yakama | 0.0 /100 | #332 | Tragic $39,107 |
| Houma | 0.0 /100 | #333 | Tragic $38,949 |
| Spanish American Indians | 0.0 /100 | #334 | Tragic $38,907 |
| Natives/Alaskans | 0.0 /100 | #335 | Tragic $38,896 |
| Crow | 0.0 /100 | #336 | Tragic $38,707 |
| Immigrants | Cuba | 0.0 /100 | #337 | Tragic $38,426 |
| Pima | 0.0 /100 | #338 | Tragic $38,285 |
| Menominee | 0.0 /100 | #339 | Tragic $37,884 |
| Navajo | 0.0 /100 | #340 | Tragic $36,999 |
| Lumbee | 0.0 /100 | #341 | Tragic $36,876 |
| Hopi | 0.0 /100 | #342 | Tragic $36,871 |
| Pueblo | 0.0 /100 | #343 | Tragic $36,859 |
| Arapaho | 0.0 /100 | #344 | Tragic $36,586 |
| Tohono O'odham | 0.0 /100 | #345 | Tragic $36,349 |