South American vs Immigrants from Colombia Median Earnings
COMPARE
South American
Immigrants from Colombia
Median Earnings
Median Earnings Comparison
South Americans
Immigrants from Colombia
$46,804
MEDIAN EARNINGS
62.7/ 100
METRIC RATING
165th/ 347
METRIC RANK
$45,550
MEDIAN EARNINGS
22.4/ 100
METRIC RATING
213th/ 347
METRIC RANK
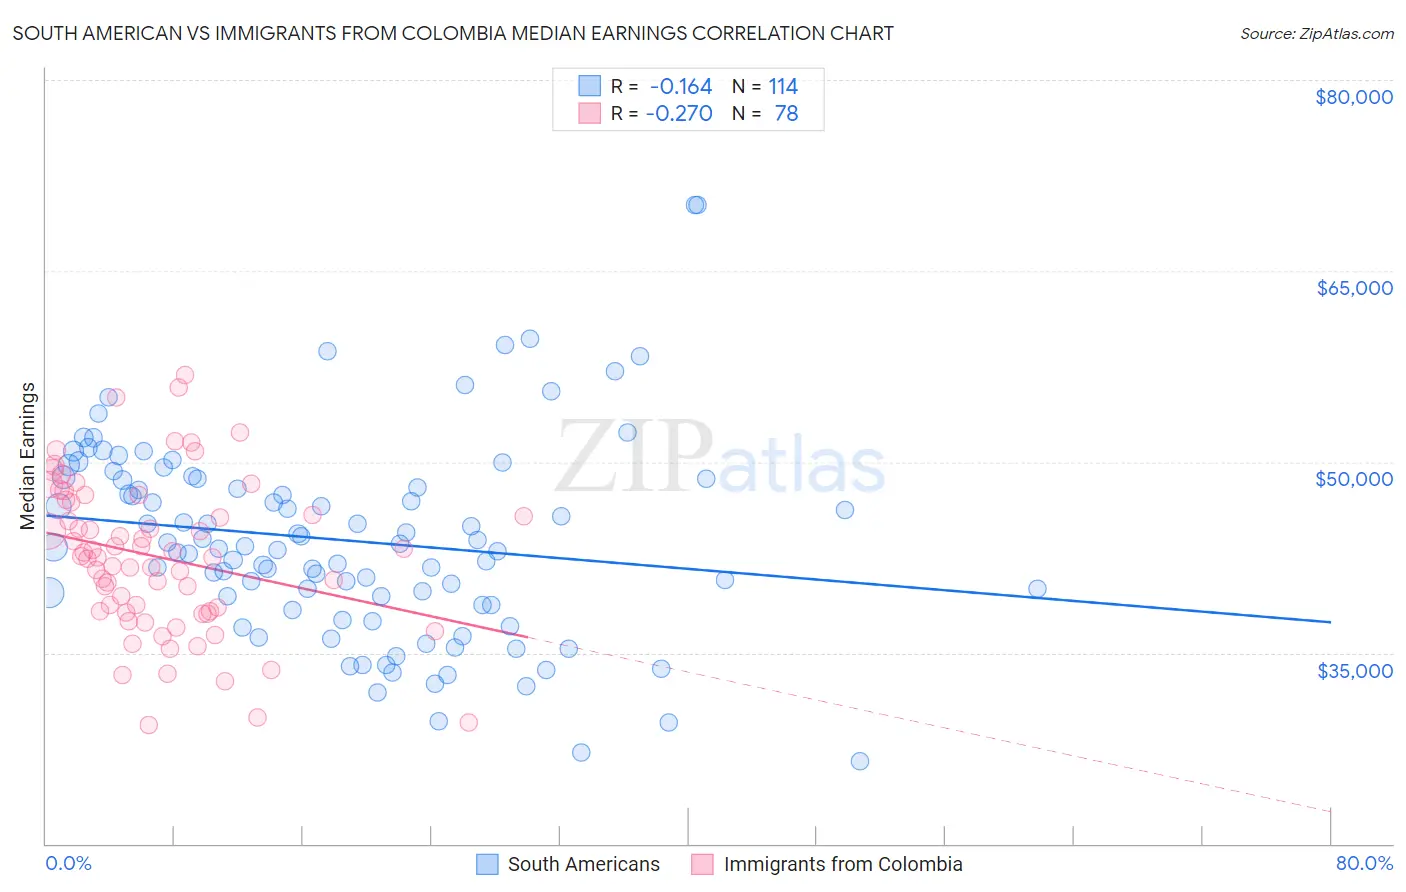
South American vs Immigrants from Colombia Median Earnings Correlation Chart
The statistical analysis conducted on geographies consisting of 494,103,874 people shows a poor negative correlation between the proportion of South Americans and median earnings in the United States with a correlation coefficient (R) of -0.164 and weighted average of $46,804. Similarly, the statistical analysis conducted on geographies consisting of 378,647,626 people shows a weak negative correlation between the proportion of Immigrants from Colombia and median earnings in the United States with a correlation coefficient (R) of -0.270 and weighted average of $45,550, a difference of 2.8%.
Median Earnings Correlation Summary
| Measurement | South American | Immigrants from Colombia |
| Minimum | $26,500 | $29,284 |
| Maximum | $70,221 | $56,800 |
| Range | $43,721 | $27,517 |
| Mean | $43,826 | $42,514 |
| Median | $43,308 | $42,568 |
| Interquartile 25% (IQ1) | $38,802 | $38,241 |
| Interquartile 75% (IQ3) | $48,652 | $46,823 |
| Interquartile Range (IQR) | $9,850 | $8,582 |
| Standard Deviation (Sample) | $7,886 | $5,984 |
| Standard Deviation (Population) | $7,851 | $5,945 |
Similar Demographics by Median Earnings
Demographics Similar to South Americans by Median Earnings
In terms of median earnings, the demographic groups most similar to South Americans are Norwegian ($46,865, a difference of 0.13%), Icelander ($46,916, a difference of 0.24%), Czechoslovakian ($46,658, a difference of 0.31%), South American Indian ($46,952, a difference of 0.32%), and Costa Rican ($46,645, a difference of 0.34%).
| Demographics | Rating | Rank | Median Earnings |
| Slovaks | 71.7 /100 | #158 | Good $47,095 |
| Immigrants | Peru | 69.6 /100 | #159 | Good $47,025 |
| Alsatians | 69.6 /100 | #160 | Good $47,023 |
| Immigrants | Eastern Africa | 68.0 /100 | #161 | Good $46,969 |
| South American Indians | 67.4 /100 | #162 | Good $46,952 |
| Icelanders | 66.3 /100 | #163 | Good $46,916 |
| Norwegians | 64.7 /100 | #164 | Good $46,865 |
| South Americans | 62.7 /100 | #165 | Good $46,804 |
| Czechoslovakians | 57.8 /100 | #166 | Average $46,658 |
| Costa Ricans | 57.4 /100 | #167 | Average $46,645 |
| Immigrants | Africa | 54.6 /100 | #168 | Average $46,564 |
| Immigrants | South America | 54.0 /100 | #169 | Average $46,548 |
| Immigrants | Immigrants | 51.6 /100 | #170 | Average $46,478 |
| Scottish | 51.1 /100 | #171 | Average $46,463 |
| Kenyans | 51.0 /100 | #172 | Average $46,462 |
Demographics Similar to Immigrants from Colombia by Median Earnings
In terms of median earnings, the demographic groups most similar to Immigrants from Colombia are Nigerian ($45,532, a difference of 0.040%), Immigrants from Bangladesh ($45,532, a difference of 0.040%), Immigrants from Grenada ($45,596, a difference of 0.10%), Panamanian ($45,593, a difference of 0.10%), and Bermudan ($45,593, a difference of 0.10%).
| Demographics | Rating | Rank | Median Earnings |
| Immigrants | Ghana | 24.8 /100 | #206 | Fair $45,641 |
| Immigrants | Senegal | 24.0 /100 | #207 | Fair $45,611 |
| Immigrants | Bosnia and Herzegovina | 23.7 /100 | #208 | Fair $45,600 |
| Immigrants | Thailand | 23.7 /100 | #209 | Fair $45,598 |
| Immigrants | Grenada | 23.6 /100 | #210 | Fair $45,596 |
| Panamanians | 23.5 /100 | #211 | Fair $45,593 |
| Bermudans | 23.5 /100 | #212 | Fair $45,593 |
| Immigrants | Colombia | 22.4 /100 | #213 | Fair $45,550 |
| Nigerians | 22.0 /100 | #214 | Fair $45,532 |
| Immigrants | Bangladesh | 22.0 /100 | #215 | Fair $45,532 |
| Guyanese | 20.6 /100 | #216 | Fair $45,470 |
| Tlingit-Haida | 20.5 /100 | #217 | Fair $45,468 |
| Spanish | 19.7 /100 | #218 | Poor $45,432 |
| Dutch | 18.4 /100 | #219 | Poor $45,370 |
| Ecuadorians | 15.3 /100 | #220 | Poor $45,214 |