Immigrants from Bangladesh vs Immigrants from Colombia Median Earnings
COMPARE
Immigrants from Bangladesh
Immigrants from Colombia
Median Earnings
Median Earnings Comparison
Immigrants from Bangladesh
Immigrants from Colombia
$45,532
MEDIAN EARNINGS
22.0/ 100
METRIC RATING
215th/ 347
METRIC RANK
$45,550
MEDIAN EARNINGS
22.4/ 100
METRIC RATING
213th/ 347
METRIC RANK
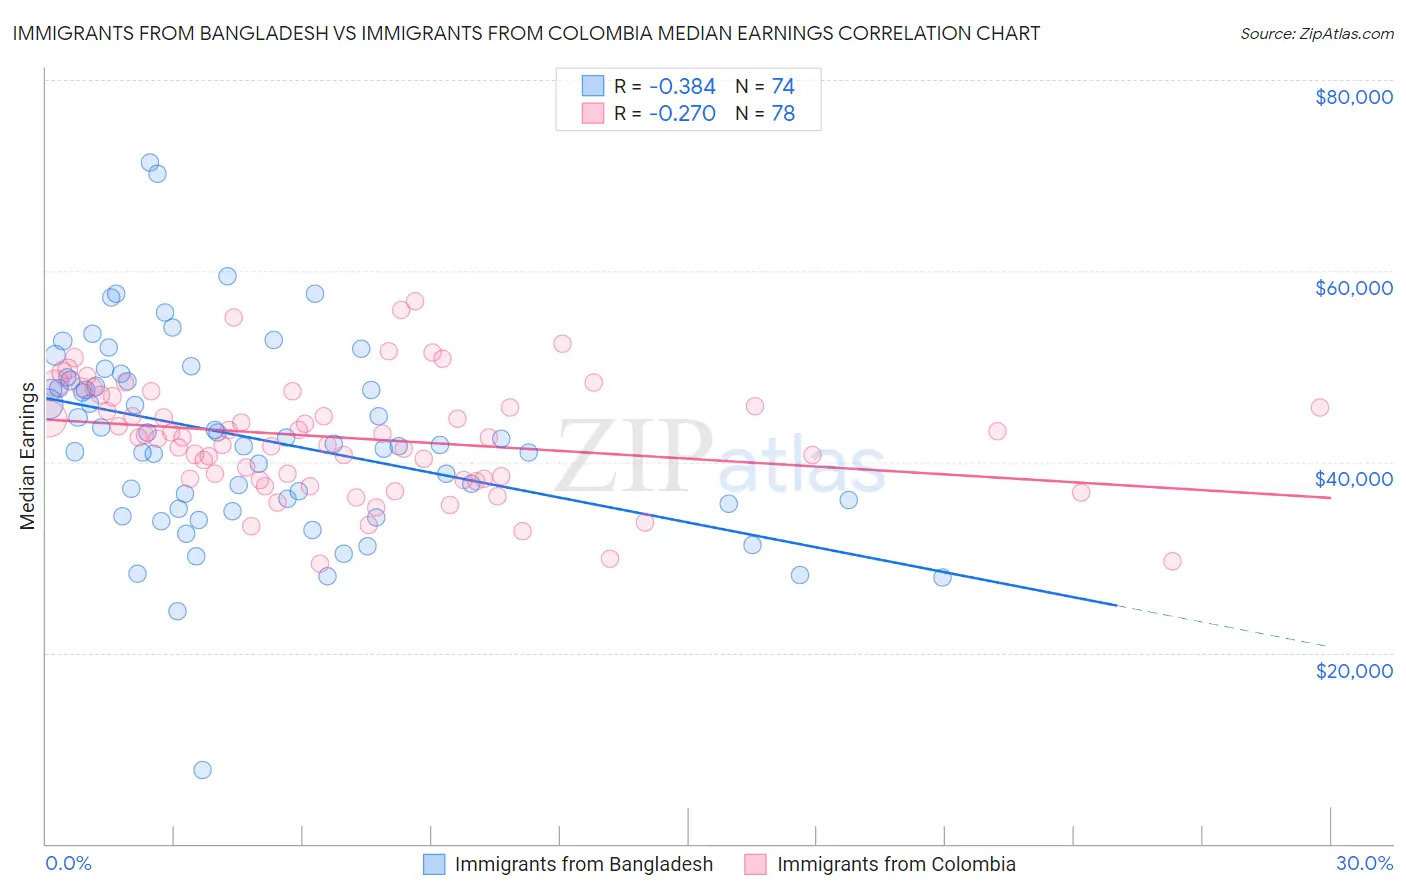
Immigrants from Bangladesh vs Immigrants from Colombia Median Earnings Correlation Chart
The statistical analysis conducted on geographies consisting of 203,670,623 people shows a mild negative correlation between the proportion of Immigrants from Bangladesh and median earnings in the United States with a correlation coefficient (R) of -0.384 and weighted average of $45,532. Similarly, the statistical analysis conducted on geographies consisting of 378,647,626 people shows a weak negative correlation between the proportion of Immigrants from Colombia and median earnings in the United States with a correlation coefficient (R) of -0.270 and weighted average of $45,550, a difference of 0.040%.
Median Earnings Correlation Summary
| Measurement | Immigrants from Bangladesh | Immigrants from Colombia |
| Minimum | $7,703 | $29,284 |
| Maximum | $71,366 | $56,800 |
| Range | $63,663 | $27,517 |
| Mean | $42,517 | $42,514 |
| Median | $42,193 | $42,568 |
| Interquartile 25% (IQ1) | $35,657 | $38,241 |
| Interquartile 75% (IQ3) | $48,515 | $46,823 |
| Interquartile Range (IQR) | $12,858 | $8,582 |
| Standard Deviation (Sample) | $10,295 | $5,984 |
| Standard Deviation (Population) | $10,225 | $5,945 |
Demographics Similar to Immigrants from Bangladesh and Immigrants from Colombia by Median Earnings
In terms of median earnings, the demographic groups most similar to Immigrants from Bangladesh are Nigerian ($45,532, a difference of 0.0%), Panamanian ($45,593, a difference of 0.13%), Bermudan ($45,593, a difference of 0.13%), Immigrants from Grenada ($45,596, a difference of 0.14%), and Guyanese ($45,470, a difference of 0.14%). Similarly, the demographic groups most similar to Immigrants from Colombia are Nigerian ($45,532, a difference of 0.040%), Immigrants from Grenada ($45,596, a difference of 0.10%), Panamanian ($45,593, a difference of 0.10%), Bermudan ($45,593, a difference of 0.10%), and Immigrants from Bosnia and Herzegovina ($45,600, a difference of 0.11%).
| Demographics | Rating | Rank | Median Earnings |
| Immigrants | Uruguay | 25.9 /100 | #204 | Fair $45,682 |
| Tongans | 25.4 /100 | #205 | Fair $45,665 |
| Immigrants | Ghana | 24.8 /100 | #206 | Fair $45,641 |
| Immigrants | Senegal | 24.0 /100 | #207 | Fair $45,611 |
| Immigrants | Bosnia and Herzegovina | 23.7 /100 | #208 | Fair $45,600 |
| Immigrants | Thailand | 23.7 /100 | #209 | Fair $45,598 |
| Immigrants | Grenada | 23.6 /100 | #210 | Fair $45,596 |
| Panamanians | 23.5 /100 | #211 | Fair $45,593 |
| Bermudans | 23.5 /100 | #212 | Fair $45,593 |
| Immigrants | Colombia | 22.4 /100 | #213 | Fair $45,550 |
| Nigerians | 22.0 /100 | #214 | Fair $45,532 |
| Immigrants | Bangladesh | 22.0 /100 | #215 | Fair $45,532 |
| Guyanese | 20.6 /100 | #216 | Fair $45,470 |
| Tlingit-Haida | 20.5 /100 | #217 | Fair $45,468 |
| Spanish | 19.7 /100 | #218 | Poor $45,432 |
| Dutch | 18.4 /100 | #219 | Poor $45,370 |
| Ecuadorians | 15.3 /100 | #220 | Poor $45,214 |
| Immigrants | Guyana | 15.1 /100 | #221 | Poor $45,204 |
| Immigrants | Panama | 15.0 /100 | #222 | Poor $45,198 |
| Whites/Caucasians | 15.0 /100 | #223 | Poor $45,197 |
| West Indians | 13.9 /100 | #224 | Poor $45,132 |