Immigrants from Iran vs Latvian 6th Grade
COMPARE
Immigrants from Iran
Latvian
6th Grade
6th Grade Comparison
Immigrants from Iran
Latvians
97.1%
6TH GRADE
63.3/ 100
METRIC RATING
158th/ 347
METRIC RANK
97.9%
6TH GRADE
99.9/ 100
METRIC RATING
40th/ 347
METRIC RANK
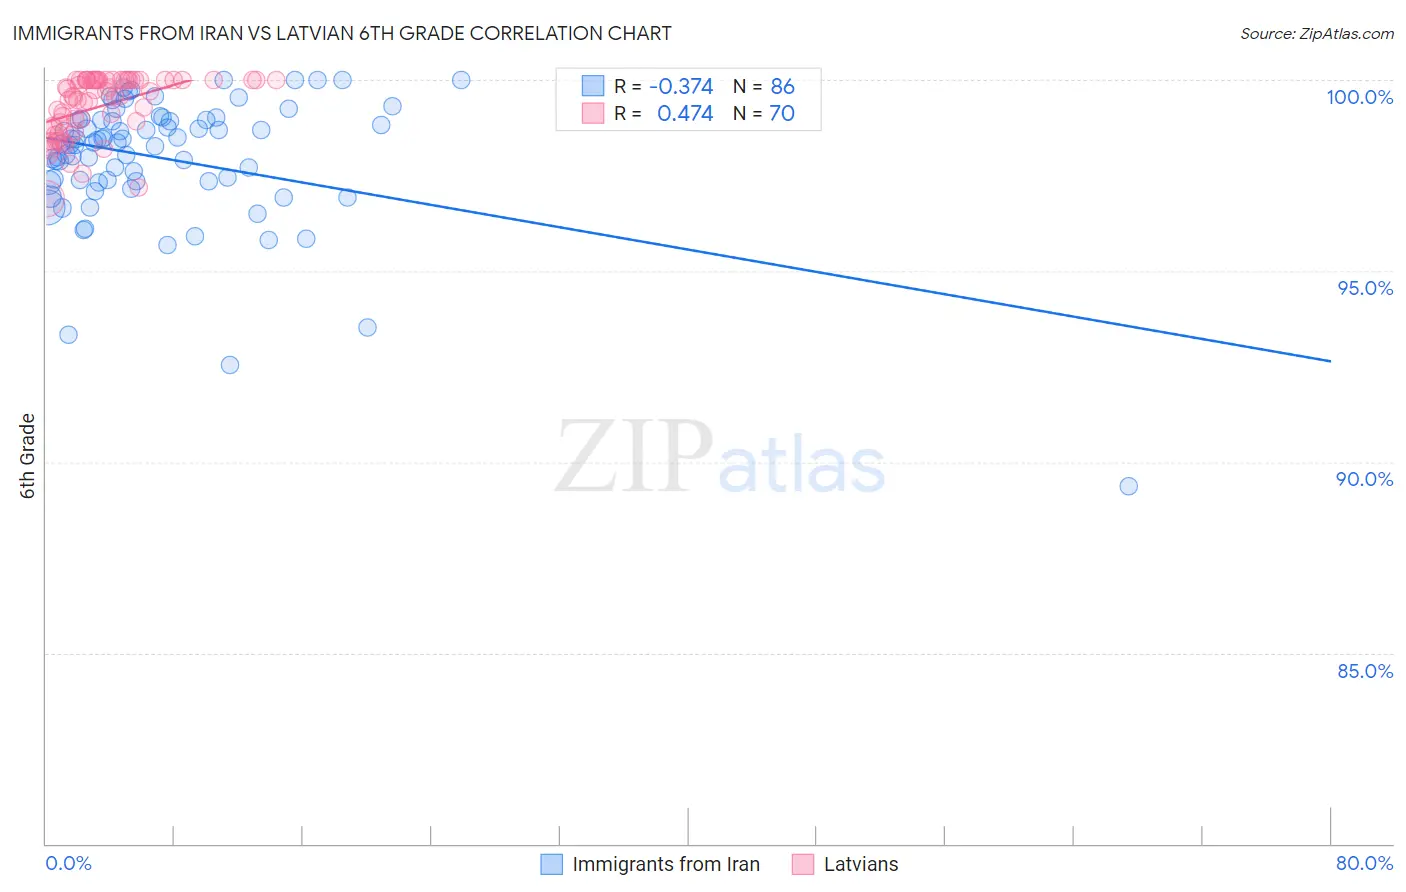
Immigrants from Iran vs Latvian 6th Grade Correlation Chart
The statistical analysis conducted on geographies consisting of 279,867,553 people shows a mild negative correlation between the proportion of Immigrants from Iran and percentage of population with at least 6th grade education in the United States with a correlation coefficient (R) of -0.374 and weighted average of 97.1%. Similarly, the statistical analysis conducted on geographies consisting of 220,726,452 people shows a moderate positive correlation between the proportion of Latvians and percentage of population with at least 6th grade education in the United States with a correlation coefficient (R) of 0.474 and weighted average of 97.9%, a difference of 0.80%.
6th Grade Correlation Summary
| Measurement | Immigrants from Iran | Latvian |
| Minimum | 89.4% | 96.9% |
| Maximum | 100.0% | 100.0% |
| Range | 10.6% | 3.1% |
| Mean | 97.9% | 99.3% |
| Median | 98.3% | 99.6% |
| Interquartile 25% (IQ1) | 97.4% | 98.7% |
| Interquartile 75% (IQ3) | 99.0% | 100.0% |
| Interquartile Range (IQR) | 1.6% | 1.3% |
| Standard Deviation (Sample) | 1.7% | 0.79% |
| Standard Deviation (Population) | 1.7% | 0.79% |
Similar Demographics by 6th Grade
Demographics Similar to Immigrants from Iran by 6th Grade
In terms of 6th grade, the demographic groups most similar to Immigrants from Iran are Kenyan (97.1%, a difference of 0.0%), Ugandan (97.1%, a difference of 0.010%), Immigrants from Belarus (97.1%, a difference of 0.010%), Marshallese (97.1%, a difference of 0.010%), and Immigrants from Russia (97.1%, a difference of 0.020%).
| Demographics | Rating | Rank | 6th Grade |
| French American Indians | 74.0 /100 | #151 | Good 97.2% |
| Immigrants | Jordan | 73.0 /100 | #152 | Good 97.2% |
| Immigrants | Eastern Europe | 72.6 /100 | #153 | Good 97.2% |
| Soviet Union | 71.5 /100 | #154 | Good 97.2% |
| Ute | 71.1 /100 | #155 | Good 97.1% |
| Alsatians | 69.8 /100 | #156 | Good 97.1% |
| Immigrants | Russia | 67.6 /100 | #157 | Good 97.1% |
| Immigrants | Iran | 63.3 /100 | #158 | Good 97.1% |
| Kenyans | 62.9 /100 | #159 | Good 97.1% |
| Ugandans | 62.2 /100 | #160 | Good 97.1% |
| Immigrants | Belarus | 60.4 /100 | #161 | Good 97.1% |
| Marshallese | 60.2 /100 | #162 | Good 97.1% |
| Albanians | 57.8 /100 | #163 | Average 97.1% |
| Immigrants | Korea | 57.7 /100 | #164 | Average 97.1% |
| Immigrants | Poland | 56.2 /100 | #165 | Average 97.1% |
Demographics Similar to Latvians by 6th Grade
In terms of 6th grade, the demographic groups most similar to Latvians are Belgian (97.9%, a difference of 0.010%), Luxembourger (97.9%, a difference of 0.010%), British (97.9%, a difference of 0.030%), Eastern European (97.9%, a difference of 0.030%), and Chinese (97.9%, a difference of 0.040%).
| Demographics | Rating | Rank | 6th Grade |
| Chippewa | 100.0 /100 | #33 | Exceptional 97.9% |
| Swiss | 100.0 /100 | #34 | Exceptional 97.9% |
| Chinese | 100.0 /100 | #35 | Exceptional 97.9% |
| Italians | 100.0 /100 | #36 | Exceptional 97.9% |
| British | 100.0 /100 | #37 | Exceptional 97.9% |
| Belgians | 100.0 /100 | #38 | Exceptional 97.9% |
| Luxembourgers | 99.9 /100 | #39 | Exceptional 97.9% |
| Latvians | 99.9 /100 | #40 | Exceptional 97.9% |
| Eastern Europeans | 99.9 /100 | #41 | Exceptional 97.9% |
| Hungarians | 99.9 /100 | #42 | Exceptional 97.8% |
| Northern Europeans | 99.9 /100 | #43 | Exceptional 97.8% |
| Czechoslovakians | 99.9 /100 | #44 | Exceptional 97.8% |
| Bulgarians | 99.9 /100 | #45 | Exceptional 97.8% |
| Arapaho | 99.9 /100 | #46 | Exceptional 97.8% |
| Native Hawaiians | 99.9 /100 | #47 | Exceptional 97.8% |