Immigrants from Hong Kong vs Tlingit-Haida Median Family Income
COMPARE
Immigrants from Hong Kong
Tlingit-Haida
Median Family Income
Median Family Income Comparison
Immigrants from Hong Kong
Tlingit-Haida
$131,067
MEDIAN FAMILY INCOME
100.0/ 100
METRIC RATING
7th/ 347
METRIC RANK
$101,092
MEDIAN FAMILY INCOME
30.8/ 100
METRIC RATING
187th/ 347
METRIC RANK
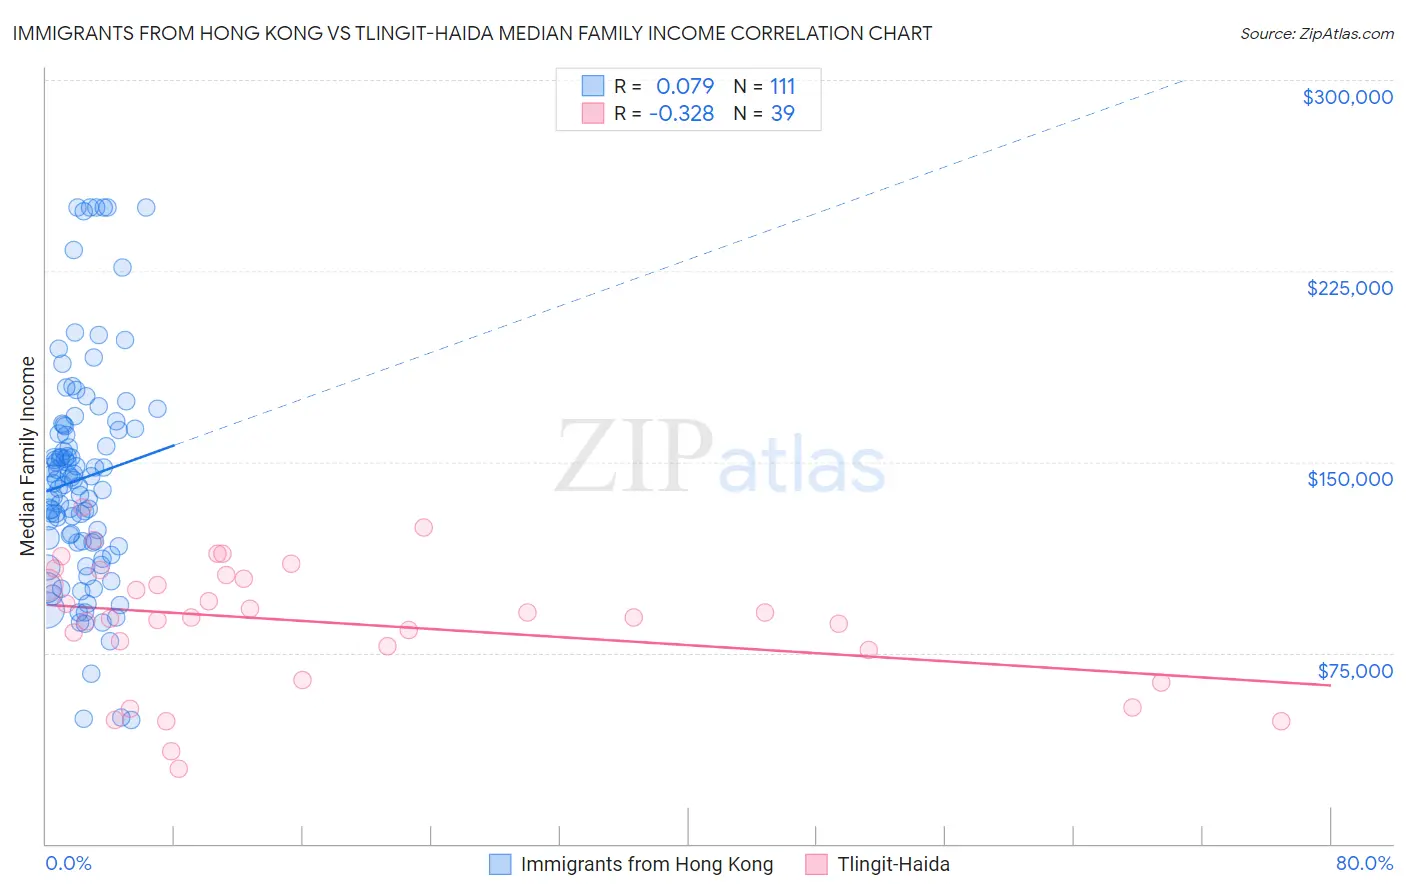
Immigrants from Hong Kong vs Tlingit-Haida Median Family Income Correlation Chart
The statistical analysis conducted on geographies consisting of 253,853,035 people shows a slight positive correlation between the proportion of Immigrants from Hong Kong and median family income in the United States with a correlation coefficient (R) of 0.079 and weighted average of $131,067. Similarly, the statistical analysis conducted on geographies consisting of 60,853,273 people shows a mild negative correlation between the proportion of Tlingit-Haida and median family income in the United States with a correlation coefficient (R) of -0.328 and weighted average of $101,092, a difference of 29.6%.
Median Family Income Correlation Summary
| Measurement | Immigrants from Hong Kong | Tlingit-Haida |
| Minimum | $48,750 | $29,250 |
| Maximum | $250,001 | $132,184 |
| Range | $201,251 | $102,934 |
| Mean | $143,316 | $86,951 |
| Median | $141,440 | $88,958 |
| Interquartile 25% (IQ1) | $118,209 | $75,972 |
| Interquartile 75% (IQ3) | $163,135 | $105,493 |
| Interquartile Range (IQR) | $44,926 | $29,521 |
| Standard Deviation (Sample) | $43,770 | $24,804 |
| Standard Deviation (Population) | $43,572 | $24,484 |
Similar Demographics by Median Family Income
Demographics Similar to Immigrants from Hong Kong by Median Family Income
In terms of median family income, the demographic groups most similar to Immigrants from Hong Kong are Immigrants from Iran ($130,894, a difference of 0.13%), Thai ($131,281, a difference of 0.16%), Okinawan ($129,979, a difference of 0.84%), Iranian ($133,839, a difference of 2.1%), and Immigrants from India ($134,028, a difference of 2.3%).
| Demographics | Rating | Rank | Median Family Income |
| Filipinos | 100.0 /100 | #1 | Exceptional $138,397 |
| Immigrants | Taiwan | 100.0 /100 | #2 | Exceptional $136,949 |
| Immigrants | Singapore | 100.0 /100 | #3 | Exceptional $134,818 |
| Immigrants | India | 100.0 /100 | #4 | Exceptional $134,028 |
| Iranians | 100.0 /100 | #5 | Exceptional $133,839 |
| Thais | 100.0 /100 | #6 | Exceptional $131,281 |
| Immigrants | Hong Kong | 100.0 /100 | #7 | Exceptional $131,067 |
| Immigrants | Iran | 100.0 /100 | #8 | Exceptional $130,894 |
| Okinawans | 100.0 /100 | #9 | Exceptional $129,979 |
| Immigrants | Ireland | 100.0 /100 | #10 | Exceptional $127,584 |
| Immigrants | Israel | 100.0 /100 | #11 | Exceptional $127,430 |
| Cypriots | 100.0 /100 | #12 | Exceptional $127,064 |
| Immigrants | Australia | 100.0 /100 | #13 | Exceptional $126,620 |
| Immigrants | South Central Asia | 100.0 /100 | #14 | Exceptional $125,956 |
| Eastern Europeans | 100.0 /100 | #15 | Exceptional $125,546 |
Demographics Similar to Tlingit-Haida by Median Family Income
In terms of median family income, the demographic groups most similar to Tlingit-Haida are Guamanian/Chamorro ($101,061, a difference of 0.030%), Celtic ($101,139, a difference of 0.050%), Dutch ($101,192, a difference of 0.10%), Immigrants from Portugal ($100,984, a difference of 0.11%), and Immigrants ($100,962, a difference of 0.13%).
| Demographics | Rating | Rank | Median Family Income |
| French Canadians | 37.0 /100 | #180 | Fair $101,634 |
| Spaniards | 36.8 /100 | #181 | Fair $101,617 |
| Tsimshian | 35.9 /100 | #182 | Fair $101,543 |
| Kenyans | 34.5 /100 | #183 | Fair $101,417 |
| Immigrants | Costa Rica | 33.7 /100 | #184 | Fair $101,354 |
| Dutch | 31.9 /100 | #185 | Fair $101,192 |
| Celtics | 31.3 /100 | #186 | Fair $101,139 |
| Tlingit-Haida | 30.8 /100 | #187 | Fair $101,092 |
| Guamanians/Chamorros | 30.5 /100 | #188 | Fair $101,061 |
| Immigrants | Portugal | 29.6 /100 | #189 | Fair $100,984 |
| Immigrants | Immigrants | 29.4 /100 | #190 | Fair $100,962 |
| Colombians | 27.2 /100 | #191 | Fair $100,750 |
| Immigrants | Kenya | 26.5 /100 | #192 | Fair $100,679 |
| Iraqis | 26.3 /100 | #193 | Fair $100,658 |
| Uruguayans | 26.3 /100 | #194 | Fair $100,656 |