Immigrants from Guyana vs Brazilian Householder Income Ages 45 - 64 years
COMPARE
Immigrants from Guyana
Brazilian
Householder Income Ages 45 - 64 years
Householder Income Ages 45 - 64 years Comparison
Immigrants from Guyana
Brazilians
$90,186
HOUSEHOLDER INCOME AGES 45 - 64 YEARS
0.6/ 100
METRIC RATING
254th/ 347
METRIC RANK
$104,408
HOUSEHOLDER INCOME AGES 45 - 64 YEARS
88.6/ 100
METRIC RATING
135th/ 347
METRIC RANK
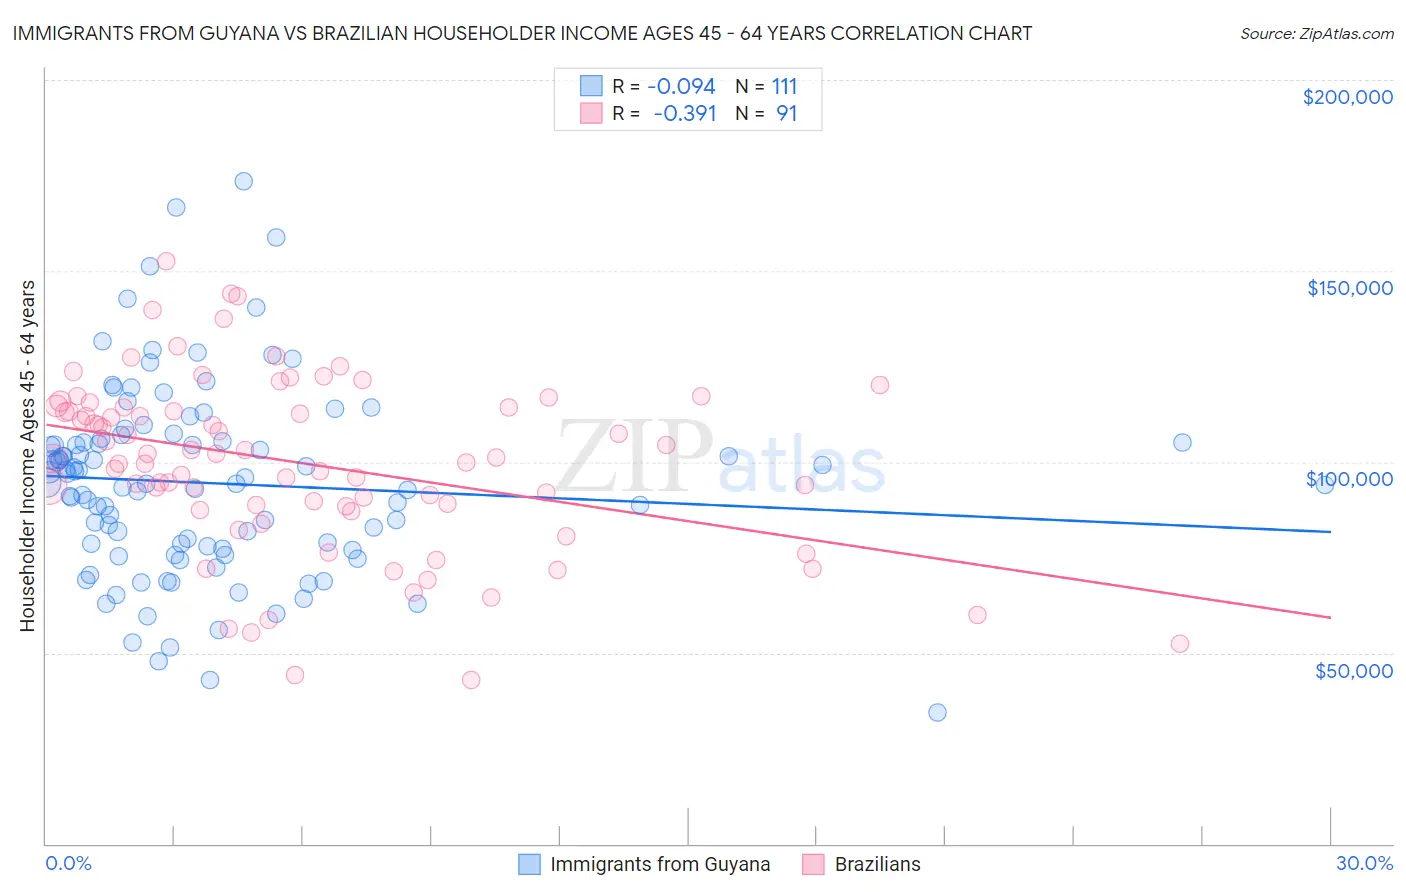
Immigrants from Guyana vs Brazilian Householder Income Ages 45 - 64 years Correlation Chart
The statistical analysis conducted on geographies consisting of 183,608,154 people shows a slight negative correlation between the proportion of Immigrants from Guyana and household income with householder between the ages 45 and 64 in the United States with a correlation coefficient (R) of -0.094 and weighted average of $90,186. Similarly, the statistical analysis conducted on geographies consisting of 323,438,021 people shows a mild negative correlation between the proportion of Brazilians and household income with householder between the ages 45 and 64 in the United States with a correlation coefficient (R) of -0.391 and weighted average of $104,408, a difference of 15.8%.
Householder Income Ages 45 - 64 years Correlation Summary
| Measurement | Immigrants from Guyana | Brazilian |
| Minimum | $34,531 | $42,860 |
| Maximum | $173,438 | $152,670 |
| Range | $138,907 | $109,810 |
| Mean | $94,395 | $99,594 |
| Median | $94,422 | $101,250 |
| Interquartile 25% (IQ1) | $77,393 | $88,262 |
| Interquartile 75% (IQ3) | $105,417 | $114,328 |
| Interquartile Range (IQR) | $28,024 | $26,066 |
| Standard Deviation (Sample) | $24,856 | $22,722 |
| Standard Deviation (Population) | $24,743 | $22,597 |
Similar Demographics by Householder Income Ages 45 - 64 years
Demographics Similar to Immigrants from Guyana by Householder Income Ages 45 - 64 years
In terms of householder income ages 45 - 64 years, the demographic groups most similar to Immigrants from Guyana are Barbadian ($90,266, a difference of 0.090%), Marshallese ($90,455, a difference of 0.30%), West Indian ($89,906, a difference of 0.31%), American ($90,536, a difference of 0.39%), and French American Indian ($89,811, a difference of 0.42%).
| Demographics | Rating | Rank | Householder Income Ages 45 - 64 years |
| Alaskan Athabascans | 0.9 /100 | #247 | Tragic $90,951 |
| Immigrants | Laos | 0.9 /100 | #248 | Tragic $90,909 |
| Mexican American Indians | 0.8 /100 | #249 | Tragic $90,811 |
| Sub-Saharan Africans | 0.8 /100 | #250 | Tragic $90,691 |
| Americans | 0.7 /100 | #251 | Tragic $90,536 |
| Marshallese | 0.7 /100 | #252 | Tragic $90,455 |
| Barbadians | 0.6 /100 | #253 | Tragic $90,266 |
| Immigrants | Guyana | 0.6 /100 | #254 | Tragic $90,186 |
| West Indians | 0.5 /100 | #255 | Tragic $89,906 |
| French American Indians | 0.5 /100 | #256 | Tragic $89,811 |
| German Russians | 0.4 /100 | #257 | Tragic $89,398 |
| Immigrants | Barbados | 0.4 /100 | #258 | Tragic $89,394 |
| Immigrants | Nicaragua | 0.4 /100 | #259 | Tragic $89,108 |
| Liberians | 0.3 /100 | #260 | Tragic $88,929 |
| Belizeans | 0.3 /100 | #261 | Tragic $88,684 |
Demographics Similar to Brazilians by Householder Income Ages 45 - 64 years
In terms of householder income ages 45 - 64 years, the demographic groups most similar to Brazilians are Arab ($104,566, a difference of 0.15%), Canadian ($104,560, a difference of 0.15%), Taiwanese ($104,180, a difference of 0.22%), Lebanese ($104,734, a difference of 0.31%), and Immigrants from Syria ($104,858, a difference of 0.43%).
| Demographics | Rating | Rank | Householder Income Ages 45 - 64 years |
| Native Hawaiians | 91.8 /100 | #128 | Exceptional $105,149 |
| Peruvians | 91.5 /100 | #129 | Exceptional $105,070 |
| Immigrants | Zimbabwe | 91.2 /100 | #130 | Exceptional $104,992 |
| Immigrants | Syria | 90.7 /100 | #131 | Exceptional $104,858 |
| Lebanese | 90.1 /100 | #132 | Exceptional $104,734 |
| Arabs | 89.3 /100 | #133 | Excellent $104,566 |
| Canadians | 89.3 /100 | #134 | Excellent $104,560 |
| Brazilians | 88.6 /100 | #135 | Excellent $104,408 |
| Taiwanese | 87.4 /100 | #136 | Excellent $104,180 |
| Hungarians | 85.8 /100 | #137 | Excellent $103,913 |
| Ethiopians | 84.7 /100 | #138 | Excellent $103,736 |
| Immigrants | Oceania | 84.5 /100 | #139 | Excellent $103,705 |
| Norwegians | 84.3 /100 | #140 | Excellent $103,682 |
| Immigrants | Uganda | 83.7 /100 | #141 | Excellent $103,584 |
| Luxembourgers | 83.3 /100 | #142 | Excellent $103,536 |