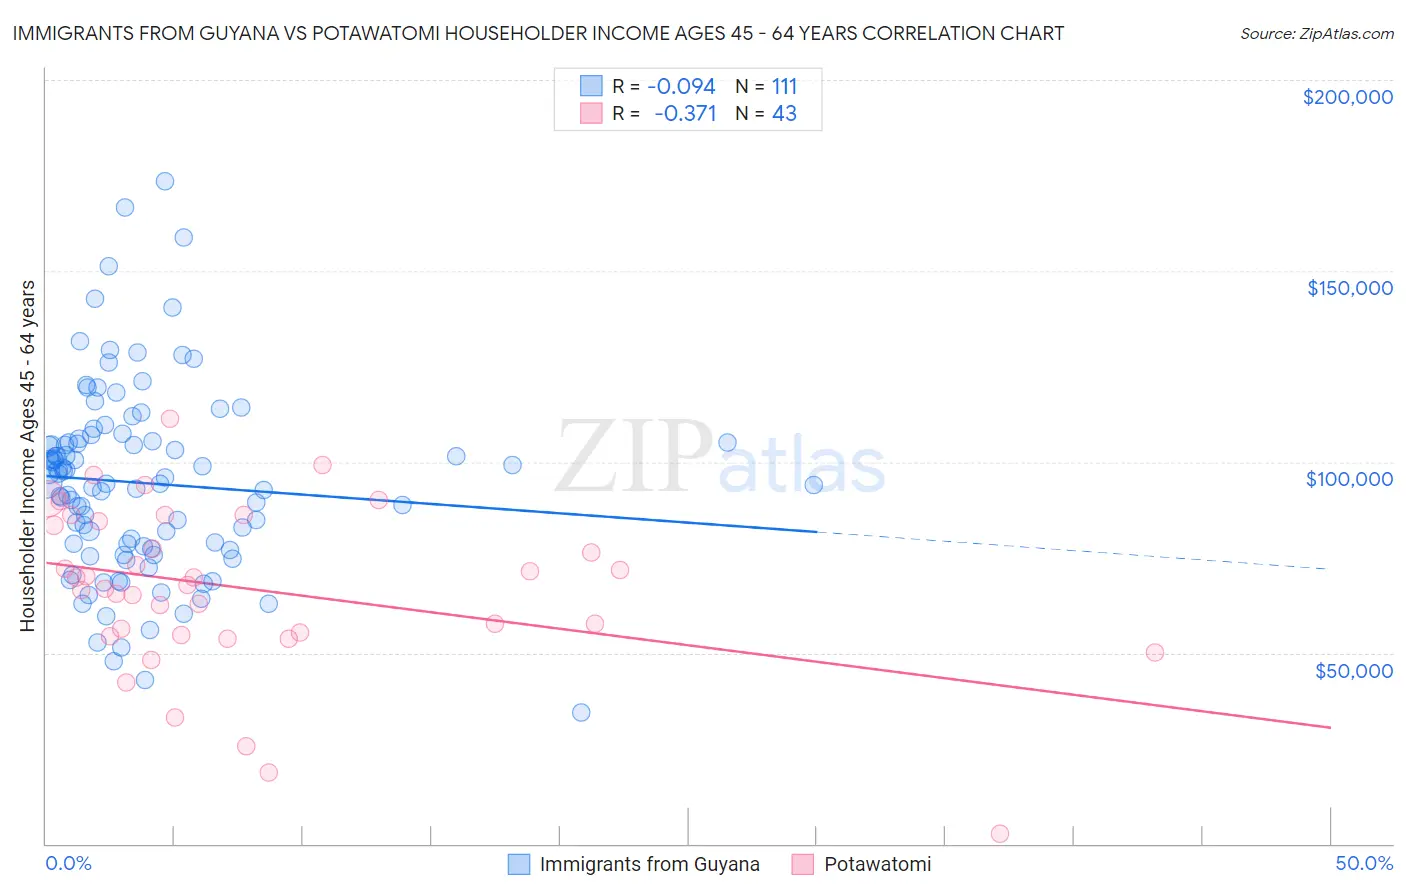
Immigrants from Guyana vs Potawatomi Householder Income Ages 45 - 64 years
COMPARE
Immigrants from Guyana
Potawatomi
Householder Income Ages 45 - 64 years
Householder Income Ages 45 - 64 years Comparison
Immigrants from Guyana
Potawatomi
$90,186
HOUSEHOLDER INCOME AGES 45 - 64 YEARS
0.6/ 100
METRIC RATING
254th/ 347
METRIC RANK
$84,613
HOUSEHOLDER INCOME AGES 45 - 64 YEARS
0.0/ 100
METRIC RATING
301st/ 347
METRIC RANK
Immigrants from Guyana vs Potawatomi Householder Income Ages 45 - 64 years Correlation Chart
The statistical analysis conducted on geographies consisting of 183,608,154 people shows a slight negative correlation between the proportion of Immigrants from Guyana and household income with householder between the ages 45 and 64 in the United States with a correlation coefficient (R) of -0.094 and weighted average of $90,186. Similarly, the statistical analysis conducted on geographies consisting of 117,696,566 people shows a mild negative correlation between the proportion of Potawatomi and household income with householder between the ages 45 and 64 in the United States with a correlation coefficient (R) of -0.371 and weighted average of $84,613, a difference of 6.6%.
Householder Income Ages 45 - 64 years Correlation Summary
| Measurement | Immigrants from Guyana | Potawatomi |
| Minimum | $34,531 | $2,499 |
| Maximum | $173,438 | $111,302 |
| Range | $138,907 | $108,803 |
| Mean | $94,395 | $66,726 |
| Median | $94,422 | $67,809 |
| Interquartile 25% (IQ1) | $77,393 | $54,506 |
| Interquartile 75% (IQ3) | $105,417 | $84,495 |
| Interquartile Range (IQR) | $28,024 | $29,989 |
| Standard Deviation (Sample) | $24,856 | $21,780 |
| Standard Deviation (Population) | $24,743 | $21,526 |
Similar Demographics by Householder Income Ages 45 - 64 years
Demographics Similar to Immigrants from Guyana by Householder Income Ages 45 - 64 years
In terms of householder income ages 45 - 64 years, the demographic groups most similar to Immigrants from Guyana are Barbadian ($90,266, a difference of 0.090%), Marshallese ($90,455, a difference of 0.30%), West Indian ($89,906, a difference of 0.31%), American ($90,536, a difference of 0.39%), and French American Indian ($89,811, a difference of 0.42%).
| Demographics | Rating | Rank | Householder Income Ages 45 - 64 years |
| Alaskan Athabascans | 0.9 /100 | #247 | Tragic $90,951 |
| Immigrants | Laos | 0.9 /100 | #248 | Tragic $90,909 |
| Mexican American Indians | 0.8 /100 | #249 | Tragic $90,811 |
| Sub-Saharan Africans | 0.8 /100 | #250 | Tragic $90,691 |
| Americans | 0.7 /100 | #251 | Tragic $90,536 |
| Marshallese | 0.7 /100 | #252 | Tragic $90,455 |
| Barbadians | 0.6 /100 | #253 | Tragic $90,266 |
| Immigrants | Guyana | 0.6 /100 | #254 | Tragic $90,186 |
| West Indians | 0.5 /100 | #255 | Tragic $89,906 |
| French American Indians | 0.5 /100 | #256 | Tragic $89,811 |
| German Russians | 0.4 /100 | #257 | Tragic $89,398 |
| Immigrants | Barbados | 0.4 /100 | #258 | Tragic $89,394 |
| Immigrants | Nicaragua | 0.4 /100 | #259 | Tragic $89,108 |
| Liberians | 0.3 /100 | #260 | Tragic $88,929 |
| Belizeans | 0.3 /100 | #261 | Tragic $88,684 |
Demographics Similar to Potawatomi by Householder Income Ages 45 - 64 years
In terms of householder income ages 45 - 64 years, the demographic groups most similar to Potawatomi are Haitian ($84,384, a difference of 0.27%), Indonesian ($84,890, a difference of 0.33%), Immigrants from Mexico ($84,910, a difference of 0.35%), African ($84,925, a difference of 0.37%), and Honduran ($84,079, a difference of 0.64%).
| Demographics | Rating | Rank | Householder Income Ages 45 - 64 years |
| British West Indians | 0.1 /100 | #294 | Tragic $85,571 |
| Immigrants | Grenada | 0.1 /100 | #295 | Tragic $85,552 |
| Immigrants | Zaire | 0.1 /100 | #296 | Tragic $85,207 |
| Fijians | 0.1 /100 | #297 | Tragic $85,187 |
| Africans | 0.0 /100 | #298 | Tragic $84,925 |
| Immigrants | Mexico | 0.0 /100 | #299 | Tragic $84,910 |
| Indonesians | 0.0 /100 | #300 | Tragic $84,890 |
| Potawatomi | 0.0 /100 | #301 | Tragic $84,613 |
| Haitians | 0.0 /100 | #302 | Tragic $84,384 |
| Hondurans | 0.0 /100 | #303 | Tragic $84,079 |
| Ottawa | 0.0 /100 | #304 | Tragic $83,953 |
| Chippewa | 0.0 /100 | #305 | Tragic $83,943 |
| Ute | 0.0 /100 | #306 | Tragic $83,937 |
| Shoshone | 0.0 /100 | #307 | Tragic $83,588 |
| Immigrants | Cabo Verde | 0.0 /100 | #308 | Tragic $83,542 |