Immigrants from Guyana vs U.S. Virgin Islander Householder Income Ages 45 - 64 years
COMPARE
Immigrants from Guyana
U.S. Virgin Islander
Householder Income Ages 45 - 64 years
Householder Income Ages 45 - 64 years Comparison
Immigrants from Guyana
U.S. Virgin Islanders
$90,186
HOUSEHOLDER INCOME AGES 45 - 64 YEARS
0.6/ 100
METRIC RATING
254th/ 347
METRIC RANK
$82,736
HOUSEHOLDER INCOME AGES 45 - 64 YEARS
0.0/ 100
METRIC RATING
313th/ 347
METRIC RANK
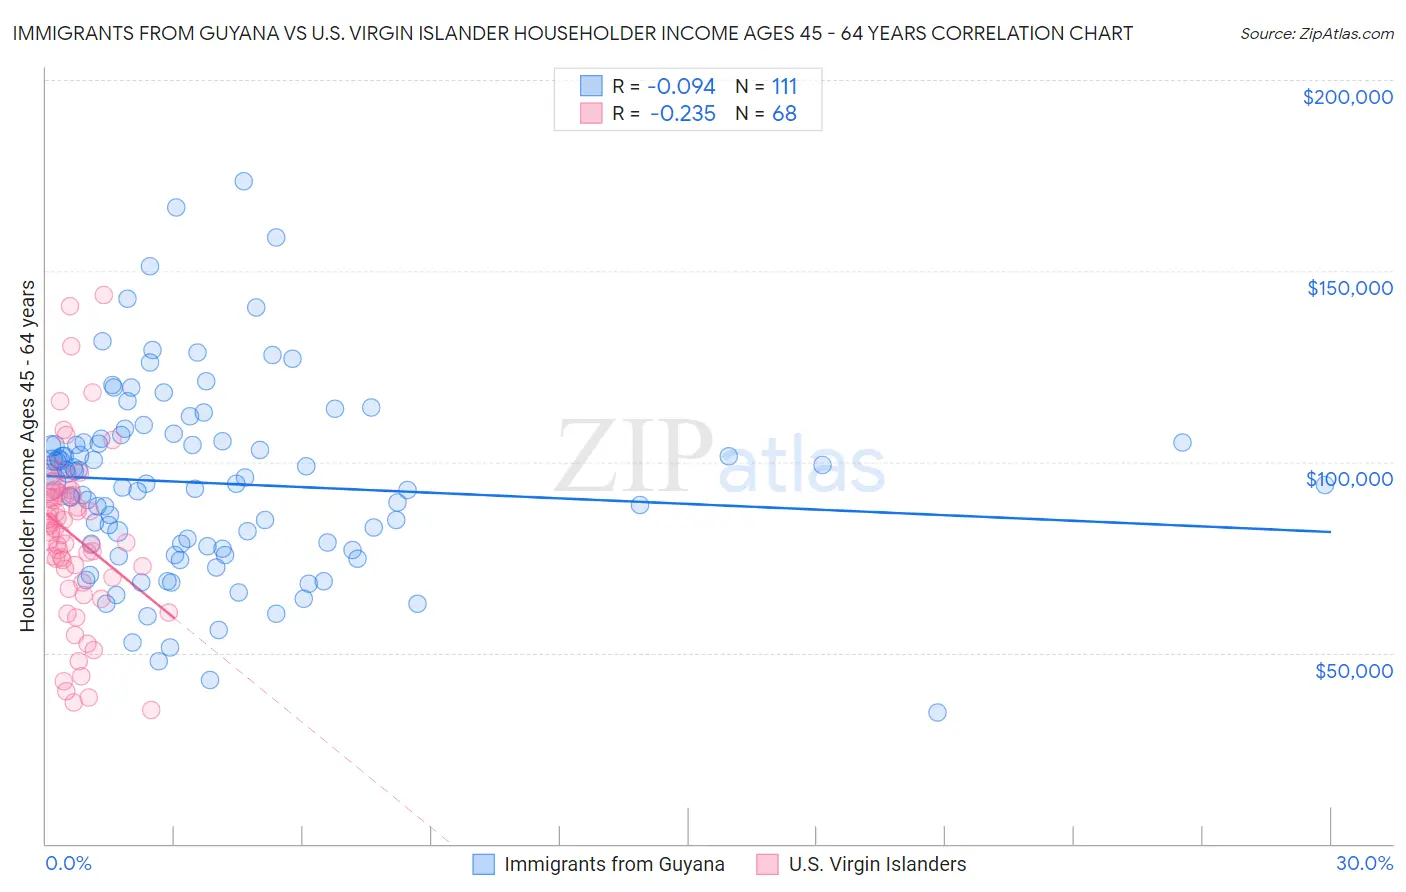
Immigrants from Guyana vs U.S. Virgin Islander Householder Income Ages 45 - 64 years Correlation Chart
The statistical analysis conducted on geographies consisting of 183,608,154 people shows a slight negative correlation between the proportion of Immigrants from Guyana and household income with householder between the ages 45 and 64 in the United States with a correlation coefficient (R) of -0.094 and weighted average of $90,186. Similarly, the statistical analysis conducted on geographies consisting of 87,479,620 people shows a weak negative correlation between the proportion of U.S. Virgin Islanders and household income with householder between the ages 45 and 64 in the United States with a correlation coefficient (R) of -0.235 and weighted average of $82,736, a difference of 9.0%.
Householder Income Ages 45 - 64 years Correlation Summary
| Measurement | Immigrants from Guyana | U.S. Virgin Islander |
| Minimum | $34,531 | $35,018 |
| Maximum | $173,438 | $143,798 |
| Range | $138,907 | $108,780 |
| Mean | $94,395 | $80,559 |
| Median | $94,422 | $81,314 |
| Interquartile 25% (IQ1) | $77,393 | $69,189 |
| Interquartile 75% (IQ3) | $105,417 | $91,656 |
| Interquartile Range (IQR) | $28,024 | $22,467 |
| Standard Deviation (Sample) | $24,856 | $22,451 |
| Standard Deviation (Population) | $24,743 | $22,285 |
Similar Demographics by Householder Income Ages 45 - 64 years
Demographics Similar to Immigrants from Guyana by Householder Income Ages 45 - 64 years
In terms of householder income ages 45 - 64 years, the demographic groups most similar to Immigrants from Guyana are Barbadian ($90,266, a difference of 0.090%), Marshallese ($90,455, a difference of 0.30%), West Indian ($89,906, a difference of 0.31%), American ($90,536, a difference of 0.39%), and French American Indian ($89,811, a difference of 0.42%).
| Demographics | Rating | Rank | Householder Income Ages 45 - 64 years |
| Alaskan Athabascans | 0.9 /100 | #247 | Tragic $90,951 |
| Immigrants | Laos | 0.9 /100 | #248 | Tragic $90,909 |
| Mexican American Indians | 0.8 /100 | #249 | Tragic $90,811 |
| Sub-Saharan Africans | 0.8 /100 | #250 | Tragic $90,691 |
| Americans | 0.7 /100 | #251 | Tragic $90,536 |
| Marshallese | 0.7 /100 | #252 | Tragic $90,455 |
| Barbadians | 0.6 /100 | #253 | Tragic $90,266 |
| Immigrants | Guyana | 0.6 /100 | #254 | Tragic $90,186 |
| West Indians | 0.5 /100 | #255 | Tragic $89,906 |
| French American Indians | 0.5 /100 | #256 | Tragic $89,811 |
| German Russians | 0.4 /100 | #257 | Tragic $89,398 |
| Immigrants | Barbados | 0.4 /100 | #258 | Tragic $89,394 |
| Immigrants | Nicaragua | 0.4 /100 | #259 | Tragic $89,108 |
| Liberians | 0.3 /100 | #260 | Tragic $88,929 |
| Belizeans | 0.3 /100 | #261 | Tragic $88,684 |
Demographics Similar to U.S. Virgin Islanders by Householder Income Ages 45 - 64 years
In terms of householder income ages 45 - 64 years, the demographic groups most similar to U.S. Virgin Islanders are Immigrants from Honduras ($82,697, a difference of 0.050%), Paiute ($82,629, a difference of 0.13%), Immigrants from Caribbean ($82,513, a difference of 0.27%), Colville ($82,474, a difference of 0.32%), and Cajun ($83,015, a difference of 0.34%).
| Demographics | Rating | Rank | Householder Income Ages 45 - 64 years |
| Ute | 0.0 /100 | #306 | Tragic $83,937 |
| Shoshone | 0.0 /100 | #307 | Tragic $83,588 |
| Immigrants | Cabo Verde | 0.0 /100 | #308 | Tragic $83,542 |
| Immigrants | Dominica | 0.0 /100 | #309 | Tragic $83,311 |
| Immigrants | Haiti | 0.0 /100 | #310 | Tragic $83,257 |
| Immigrants | Bahamas | 0.0 /100 | #311 | Tragic $83,177 |
| Cajuns | 0.0 /100 | #312 | Tragic $83,015 |
| U.S. Virgin Islanders | 0.0 /100 | #313 | Tragic $82,736 |
| Immigrants | Honduras | 0.0 /100 | #314 | Tragic $82,697 |
| Paiute | 0.0 /100 | #315 | Tragic $82,629 |
| Immigrants | Caribbean | 0.0 /100 | #316 | Tragic $82,513 |
| Colville | 0.0 /100 | #317 | Tragic $82,474 |
| Choctaw | 0.0 /100 | #318 | Tragic $82,287 |
| Chickasaw | 0.0 /100 | #319 | Tragic $82,193 |
| Apache | 0.0 /100 | #320 | Tragic $82,184 |