Immigrants from Guyana vs Iroquois Householder Income Ages 45 - 64 years
COMPARE
Immigrants from Guyana
Iroquois
Householder Income Ages 45 - 64 years
Householder Income Ages 45 - 64 years Comparison
Immigrants from Guyana
Iroquois
$90,186
HOUSEHOLDER INCOME AGES 45 - 64 YEARS
0.6/ 100
METRIC RATING
254th/ 347
METRIC RANK
$87,255
HOUSEHOLDER INCOME AGES 45 - 64 YEARS
0.1/ 100
METRIC RATING
274th/ 347
METRIC RANK
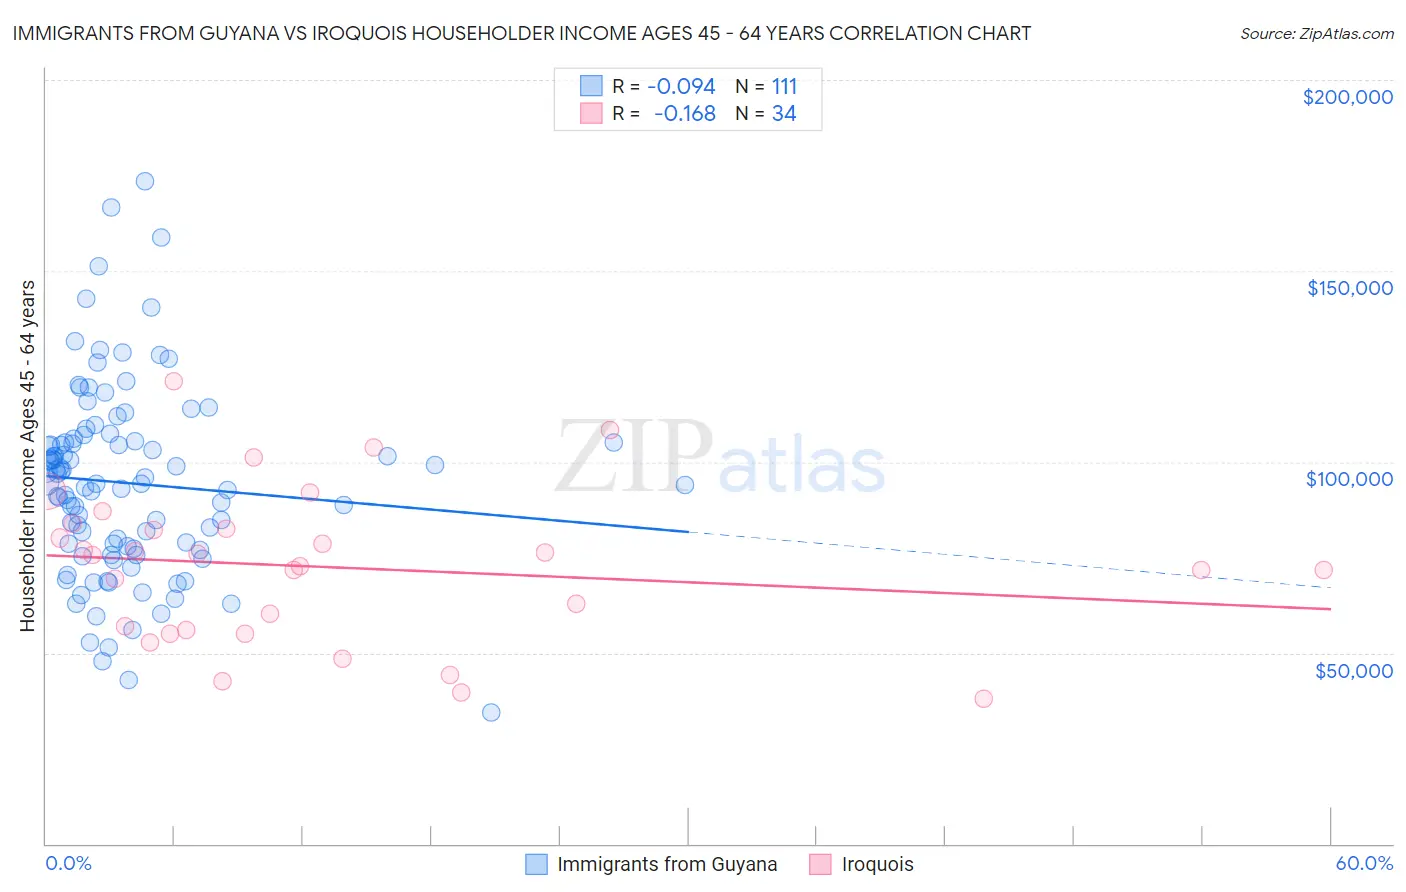
Immigrants from Guyana vs Iroquois Householder Income Ages 45 - 64 years Correlation Chart
The statistical analysis conducted on geographies consisting of 183,608,154 people shows a slight negative correlation between the proportion of Immigrants from Guyana and household income with householder between the ages 45 and 64 in the United States with a correlation coefficient (R) of -0.094 and weighted average of $90,186. Similarly, the statistical analysis conducted on geographies consisting of 207,070,070 people shows a poor negative correlation between the proportion of Iroquois and household income with householder between the ages 45 and 64 in the United States with a correlation coefficient (R) of -0.168 and weighted average of $87,255, a difference of 3.4%.
Householder Income Ages 45 - 64 years Correlation Summary
| Measurement | Immigrants from Guyana | Iroquois |
| Minimum | $34,531 | $38,056 |
| Maximum | $173,438 | $121,151 |
| Range | $138,907 | $83,095 |
| Mean | $94,395 | $72,442 |
| Median | $94,422 | $74,085 |
| Interquartile 25% (IQ1) | $77,393 | $55,882 |
| Interquartile 75% (IQ3) | $105,417 | $82,434 |
| Interquartile Range (IQR) | $28,024 | $26,552 |
| Standard Deviation (Sample) | $24,856 | $20,014 |
| Standard Deviation (Population) | $24,743 | $19,717 |
Demographics Similar to Immigrants from Guyana and Iroquois by Householder Income Ages 45 - 64 years
In terms of householder income ages 45 - 64 years, the demographic groups most similar to Immigrants from Guyana are West Indian ($89,906, a difference of 0.31%), French American Indian ($89,811, a difference of 0.42%), German Russian ($89,398, a difference of 0.88%), Immigrants from Barbados ($89,394, a difference of 0.89%), and Immigrants from Nicaragua ($89,108, a difference of 1.2%). Similarly, the demographic groups most similar to Iroquois are Spanish American Indian ($87,561, a difference of 0.35%), Cape Verdean ($87,580, a difference of 0.37%), Guatemalan ($87,705, a difference of 0.52%), Immigrants from Liberia ($87,739, a difference of 0.55%), and Spanish American ($87,836, a difference of 0.67%).
| Demographics | Rating | Rank | Householder Income Ages 45 - 64 years |
| Immigrants | Guyana | 0.6 /100 | #254 | Tragic $90,186 |
| West Indians | 0.5 /100 | #255 | Tragic $89,906 |
| French American Indians | 0.5 /100 | #256 | Tragic $89,811 |
| German Russians | 0.4 /100 | #257 | Tragic $89,398 |
| Immigrants | Barbados | 0.4 /100 | #258 | Tragic $89,394 |
| Immigrants | Nicaragua | 0.4 /100 | #259 | Tragic $89,108 |
| Liberians | 0.3 /100 | #260 | Tragic $88,929 |
| Belizeans | 0.3 /100 | #261 | Tragic $88,684 |
| Somalis | 0.3 /100 | #262 | Tragic $88,600 |
| Immigrants | Senegal | 0.3 /100 | #263 | Tragic $88,421 |
| Osage | 0.3 /100 | #264 | Tragic $88,390 |
| Jamaicans | 0.2 /100 | #265 | Tragic $88,327 |
| Immigrants | West Indies | 0.2 /100 | #266 | Tragic $88,164 |
| Hmong | 0.2 /100 | #267 | Tragic $88,115 |
| Immigrants | Micronesia | 0.2 /100 | #268 | Tragic $87,864 |
| Spanish Americans | 0.2 /100 | #269 | Tragic $87,836 |
| Immigrants | Liberia | 0.2 /100 | #270 | Tragic $87,739 |
| Guatemalans | 0.2 /100 | #271 | Tragic $87,705 |
| Cape Verdeans | 0.2 /100 | #272 | Tragic $87,580 |
| Spanish American Indians | 0.2 /100 | #273 | Tragic $87,561 |
| Iroquois | 0.1 /100 | #274 | Tragic $87,255 |