Immigrants from England vs Slovak Unemployment Among Ages 20 to 24 years
COMPARE
Immigrants from England
Slovak
Unemployment Among Ages 20 to 24 years
Unemployment Among Ages 20 to 24 years Comparison
Immigrants from England
Slovaks
10.3%
UNEMPLOYMENT AMONG AGES 20 TO 24 YEARS
63.7/ 100
METRIC RATING
159th/ 347
METRIC RANK
10.2%
UNEMPLOYMENT AMONG AGES 20 TO 24 YEARS
80.2/ 100
METRIC RATING
142nd/ 347
METRIC RANK
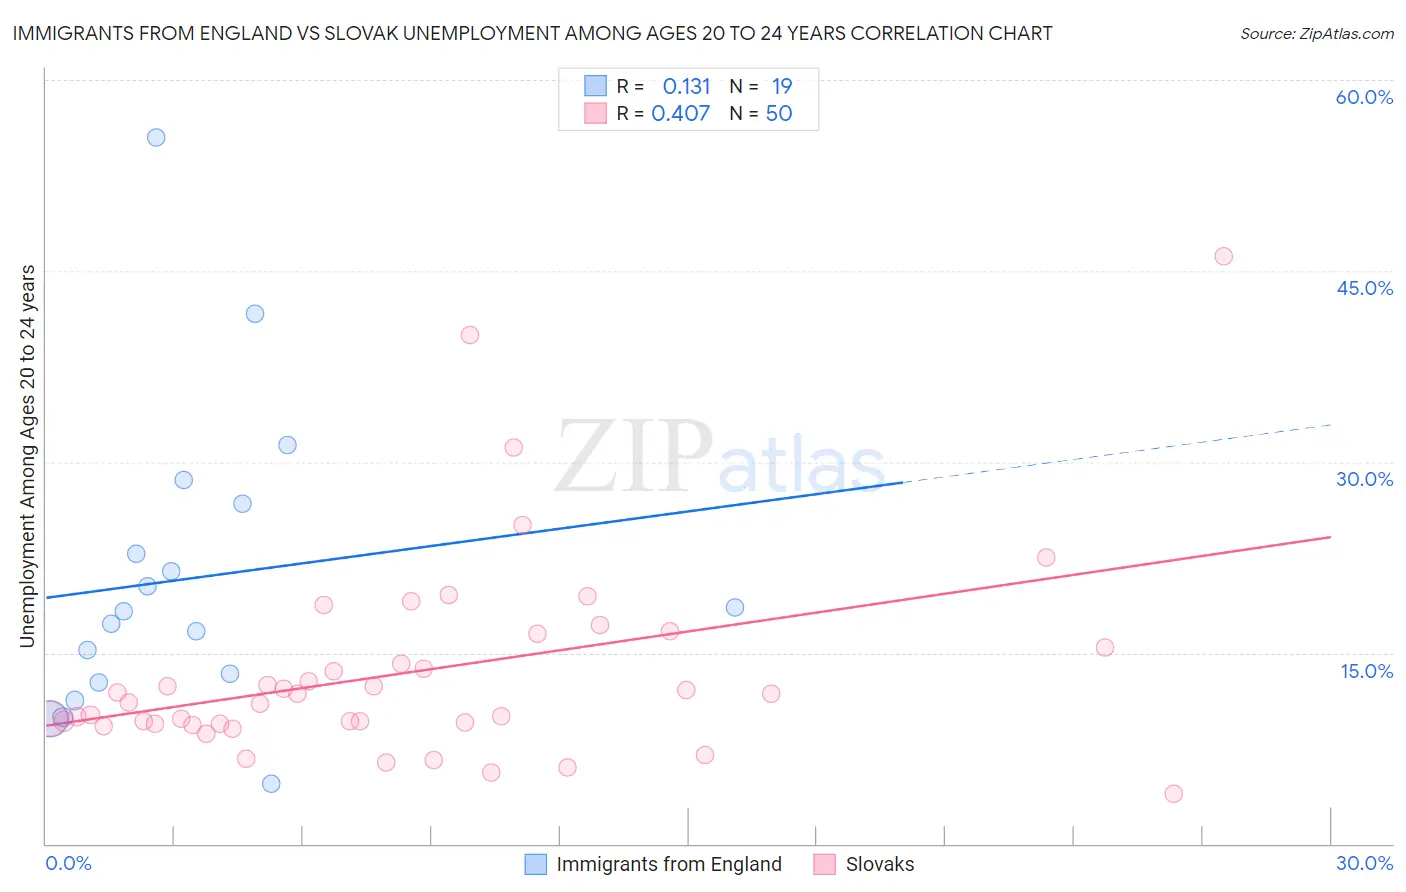
Immigrants from England vs Slovak Unemployment Among Ages 20 to 24 years Correlation Chart
The statistical analysis conducted on geographies consisting of 378,161,637 people shows a poor positive correlation between the proportion of Immigrants from England and unemployment rate among population between the ages 20 and 24 in the United States with a correlation coefficient (R) of 0.131 and weighted average of 10.3%. Similarly, the statistical analysis conducted on geographies consisting of 381,138,235 people shows a moderate positive correlation between the proportion of Slovaks and unemployment rate among population between the ages 20 and 24 in the United States with a correlation coefficient (R) of 0.407 and weighted average of 10.2%, a difference of 0.78%.
Unemployment Among Ages 20 to 24 years Correlation Summary
| Measurement | Immigrants from England | Slovak |
| Minimum | 4.7% | 3.9% |
| Maximum | 55.5% | 46.2% |
| Range | 50.8% | 42.3% |
| Mean | 20.8% | 13.5% |
| Median | 18.3% | 11.5% |
| Interquartile 25% (IQ1) | 12.6% | 9.5% |
| Interquartile 75% (IQ3) | 26.7% | 15.4% |
| Interquartile Range (IQR) | 14.1% | 5.9% |
| Standard Deviation (Sample) | 12.1% | 8.0% |
| Standard Deviation (Population) | 11.8% | 7.9% |
Demographics Similar to Immigrants from England and Slovaks by Unemployment Among Ages 20 to 24 years
In terms of unemployment among ages 20 to 24 years, the demographic groups most similar to Immigrants from England are Spaniard (10.3%, a difference of 0.010%), Immigrants from Kazakhstan (10.2%, a difference of 0.070%), Immigrants from Uganda (10.2%, a difference of 0.080%), Canadian (10.2%, a difference of 0.12%), and Lithuanian (10.2%, a difference of 0.26%). Similarly, the demographic groups most similar to Slovaks are Immigrants from Austria (10.2%, a difference of 0.070%), Immigrants from the Azores (10.2%, a difference of 0.070%), Immigrants from Jordan (10.2%, a difference of 0.070%), Brazilian (10.2%, a difference of 0.11%), and Argentinean (10.2%, a difference of 0.13%).
| Demographics | Rating | Rank | Unemployment Among Ages 20 to 24 years |
| Immigrants | Austria | 81.4 /100 | #140 | Excellent 10.2% |
| Immigrants | Azores | 81.4 /100 | #141 | Excellent 10.2% |
| Slovaks | 80.2 /100 | #142 | Excellent 10.2% |
| Immigrants | Jordan | 79.0 /100 | #143 | Good 10.2% |
| Brazilians | 78.4 /100 | #144 | Good 10.2% |
| Argentineans | 78.0 /100 | #145 | Good 10.2% |
| Asians | 77.7 /100 | #146 | Good 10.2% |
| French Canadians | 77.5 /100 | #147 | Good 10.2% |
| Immigrants | Romania | 75.7 /100 | #148 | Good 10.2% |
| Immigrants | Scotland | 74.6 /100 | #149 | Good 10.2% |
| Hungarians | 74.4 /100 | #150 | Good 10.2% |
| Immigrants | South Africa | 73.6 /100 | #151 | Good 10.2% |
| Iranians | 72.4 /100 | #152 | Good 10.2% |
| Immigrants | Taiwan | 71.4 /100 | #153 | Good 10.2% |
| Immigrants | Switzerland | 71.3 /100 | #154 | Good 10.2% |
| Lithuanians | 70.0 /100 | #155 | Good 10.2% |
| Canadians | 66.7 /100 | #156 | Good 10.2% |
| Immigrants | Uganda | 65.6 /100 | #157 | Good 10.2% |
| Immigrants | Kazakhstan | 65.5 /100 | #158 | Good 10.2% |
| Immigrants | England | 63.7 /100 | #159 | Good 10.3% |
| Spaniards | 63.4 /100 | #160 | Good 10.3% |