Immigrants from Eastern Africa vs Immigrants from Scotland Median Earnings
COMPARE
Immigrants from Eastern Africa
Immigrants from Scotland
Median Earnings
Median Earnings Comparison
Immigrants from Eastern Africa
Immigrants from Scotland
$46,969
MEDIAN EARNINGS
68.0/ 100
METRIC RATING
161st/ 347
METRIC RANK
$50,741
MEDIAN EARNINGS
99.8/ 100
METRIC RATING
75th/ 347
METRIC RANK
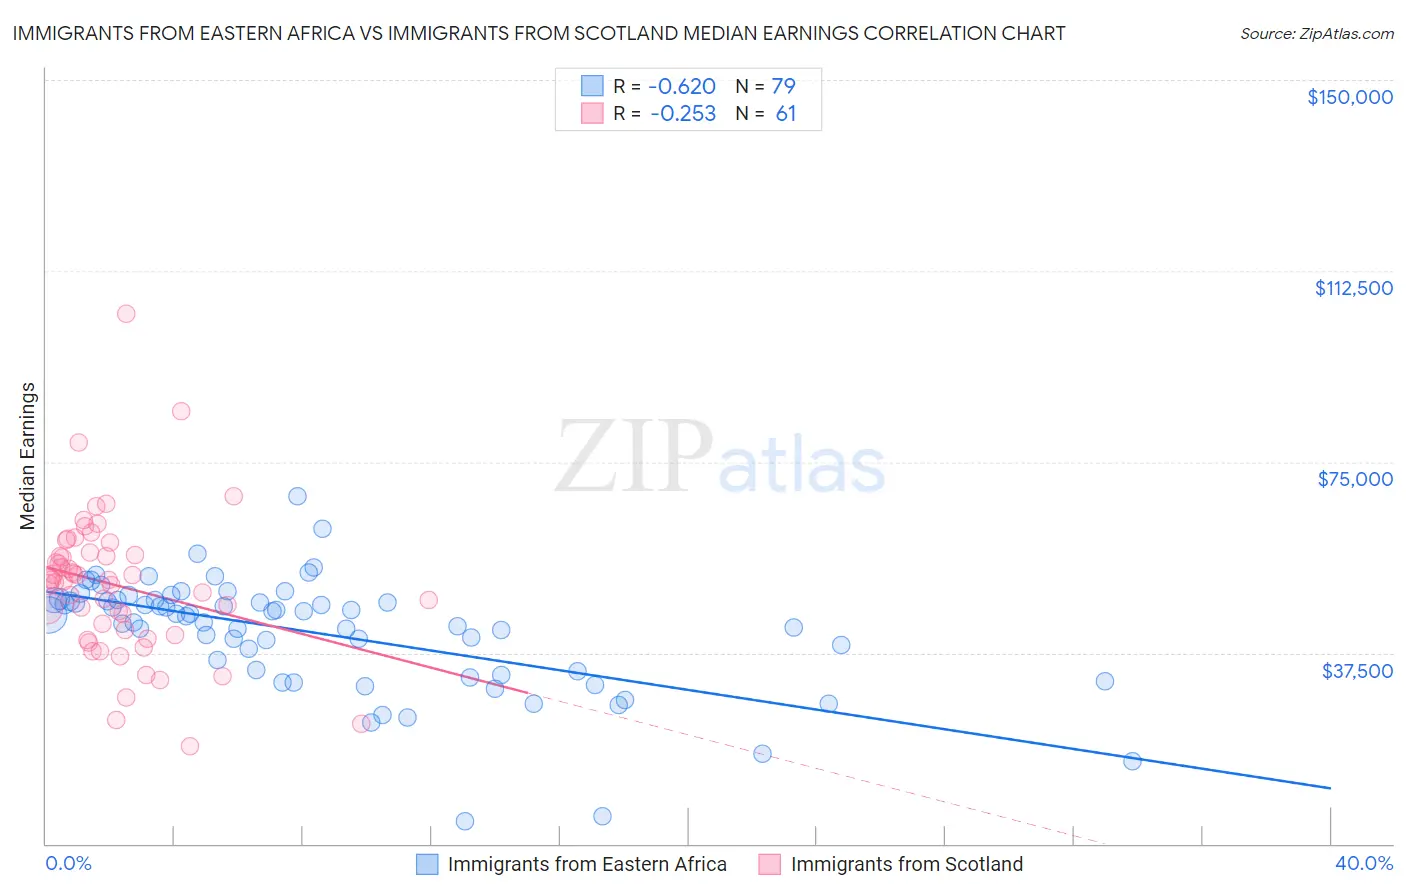
Immigrants from Eastern Africa vs Immigrants from Scotland Median Earnings Correlation Chart
The statistical analysis conducted on geographies consisting of 355,152,385 people shows a significant negative correlation between the proportion of Immigrants from Eastern Africa and median earnings in the United States with a correlation coefficient (R) of -0.620 and weighted average of $46,969. Similarly, the statistical analysis conducted on geographies consisting of 196,389,390 people shows a weak negative correlation between the proportion of Immigrants from Scotland and median earnings in the United States with a correlation coefficient (R) of -0.253 and weighted average of $50,741, a difference of 8.0%.
Median Earnings Correlation Summary
| Measurement | Immigrants from Eastern Africa | Immigrants from Scotland |
| Minimum | $4,426 | $19,118 |
| Maximum | $68,236 | $104,015 |
| Range | $63,810 | $84,897 |
| Mean | $41,397 | $50,819 |
| Median | $44,805 | $51,683 |
| Interquartile 25% (IQ1) | $33,958 | $41,420 |
| Interquartile 75% (IQ3) | $47,783 | $56,954 |
| Interquartile Range (IQR) | $13,825 | $15,534 |
| Standard Deviation (Sample) | $11,219 | $14,157 |
| Standard Deviation (Population) | $11,147 | $14,040 |
Similar Demographics by Median Earnings
Demographics Similar to Immigrants from Eastern Africa by Median Earnings
In terms of median earnings, the demographic groups most similar to Immigrants from Eastern Africa are South American Indian ($46,952, a difference of 0.040%), Alsatian ($47,023, a difference of 0.11%), Icelander ($46,916, a difference of 0.11%), Immigrants from Peru ($47,025, a difference of 0.12%), and Norwegian ($46,865, a difference of 0.22%).
| Demographics | Rating | Rank | Median Earnings |
| Immigrants | Portugal | 77.3 /100 | #154 | Good $47,304 |
| Immigrants | Vietnam | 76.7 /100 | #155 | Good $47,282 |
| Irish | 76.6 /100 | #156 | Good $47,276 |
| Czechs | 75.1 /100 | #157 | Good $47,221 |
| Slovaks | 71.7 /100 | #158 | Good $47,095 |
| Immigrants | Peru | 69.6 /100 | #159 | Good $47,025 |
| Alsatians | 69.6 /100 | #160 | Good $47,023 |
| Immigrants | Eastern Africa | 68.0 /100 | #161 | Good $46,969 |
| South American Indians | 67.4 /100 | #162 | Good $46,952 |
| Icelanders | 66.3 /100 | #163 | Good $46,916 |
| Norwegians | 64.7 /100 | #164 | Good $46,865 |
| South Americans | 62.7 /100 | #165 | Good $46,804 |
| Czechoslovakians | 57.8 /100 | #166 | Average $46,658 |
| Costa Ricans | 57.4 /100 | #167 | Average $46,645 |
| Immigrants | Africa | 54.6 /100 | #168 | Average $46,564 |
Demographics Similar to Immigrants from Scotland by Median Earnings
In terms of median earnings, the demographic groups most similar to Immigrants from Scotland are South African ($50,752, a difference of 0.020%), Immigrants from Netherlands ($50,818, a difference of 0.15%), Immigrants from Egypt ($50,901, a difference of 0.32%), Immigrants from Italy ($50,581, a difference of 0.32%), and Immigrants from Western Europe ($50,549, a difference of 0.38%).
| Demographics | Rating | Rank | Median Earnings |
| Paraguayans | 99.9 /100 | #68 | Exceptional $51,068 |
| Mongolians | 99.8 /100 | #69 | Exceptional $51,038 |
| Lithuanians | 99.8 /100 | #70 | Exceptional $50,991 |
| Immigrants | Ukraine | 99.8 /100 | #71 | Exceptional $50,984 |
| Immigrants | Egypt | 99.8 /100 | #72 | Exceptional $50,901 |
| Immigrants | Netherlands | 99.8 /100 | #73 | Exceptional $50,818 |
| South Africans | 99.8 /100 | #74 | Exceptional $50,752 |
| Immigrants | Scotland | 99.8 /100 | #75 | Exceptional $50,741 |
| Immigrants | Italy | 99.7 /100 | #76 | Exceptional $50,581 |
| Immigrants | Western Europe | 99.7 /100 | #77 | Exceptional $50,549 |
| Argentineans | 99.6 /100 | #78 | Exceptional $50,399 |
| Laotians | 99.6 /100 | #79 | Exceptional $50,343 |
| Ukrainians | 99.6 /100 | #80 | Exceptional $50,320 |
| Immigrants | Southern Europe | 99.6 /100 | #81 | Exceptional $50,280 |
| Immigrants | Moldova | 99.5 /100 | #82 | Exceptional $50,274 |