Immigrants from Dominican Republic vs Cajun In Labor Force | Age 25-29
COMPARE
Immigrants from Dominican Republic
Cajun
In Labor Force | Age 25-29
In Labor Force | Age 25-29 Comparison
Immigrants from Dominican Republic
Cajuns
83.1%
IN LABOR FORCE | AGE 25-29
0.0/ 100
METRIC RATING
281st/ 347
METRIC RANK
82.5%
IN LABOR FORCE | AGE 25-29
0.0/ 100
METRIC RATING
307th/ 347
METRIC RANK
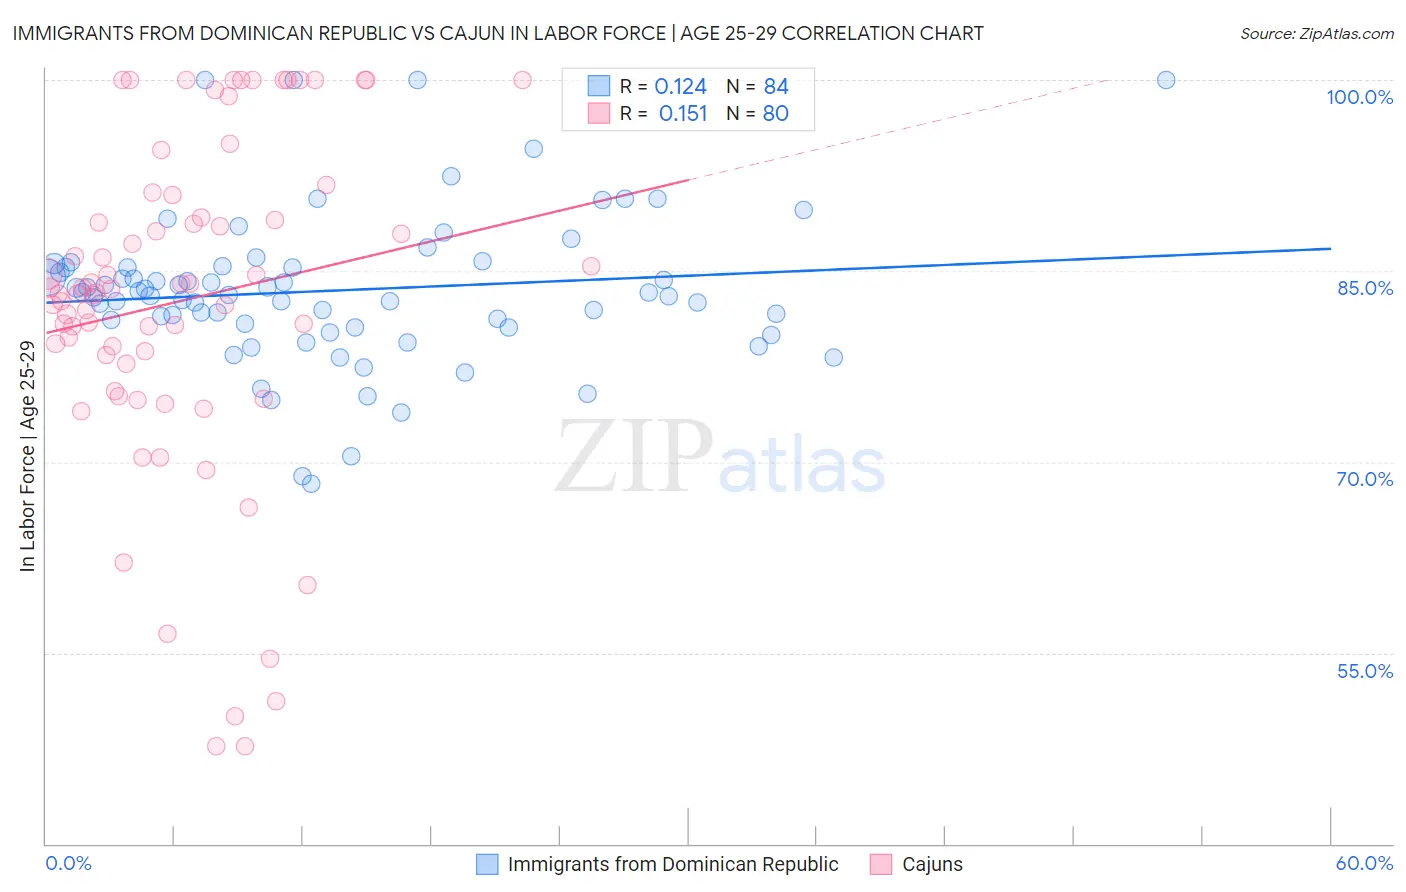
Immigrants from Dominican Republic vs Cajun In Labor Force | Age 25-29 Correlation Chart
The statistical analysis conducted on geographies consisting of 275,085,250 people shows a poor positive correlation between the proportion of Immigrants from Dominican Republic and labor force participation rate among population between the ages 25 and 29 in the United States with a correlation coefficient (R) of 0.124 and weighted average of 83.1%. Similarly, the statistical analysis conducted on geographies consisting of 149,675,482 people shows a poor positive correlation between the proportion of Cajuns and labor force participation rate among population between the ages 25 and 29 in the United States with a correlation coefficient (R) of 0.151 and weighted average of 82.5%, a difference of 0.70%.
In Labor Force | Age 25-29 Correlation Summary
| Measurement | Immigrants from Dominican Republic | Cajun |
| Minimum | 68.3% | 47.7% |
| Maximum | 100.0% | 100.0% |
| Range | 31.7% | 52.3% |
| Mean | 83.5% | 82.7% |
| Median | 83.2% | 83.4% |
| Interquartile 25% (IQ1) | 80.7% | 78.0% |
| Interquartile 75% (IQ3) | 85.3% | 90.1% |
| Interquartile Range (IQR) | 4.6% | 12.1% |
| Standard Deviation (Sample) | 6.0% | 13.1% |
| Standard Deviation (Population) | 6.0% | 13.0% |
Similar Demographics by In Labor Force | Age 25-29
Demographics Similar to Immigrants from Dominican Republic by In Labor Force | Age 25-29
In terms of in labor force | age 25-29, the demographic groups most similar to Immigrants from Dominican Republic are American (83.1%, a difference of 0.010%), Immigrants from the Azores (83.1%, a difference of 0.010%), Nicaraguan (83.1%, a difference of 0.030%), Dominican (83.2%, a difference of 0.060%), and Belizean (83.1%, a difference of 0.070%).
| Demographics | Rating | Rank | In Labor Force | Age 25-29 |
| Marshallese | 0.0 /100 | #274 | Tragic 83.3% |
| Samoans | 0.0 /100 | #275 | Tragic 83.3% |
| Immigrants | Honduras | 0.0 /100 | #276 | Tragic 83.3% |
| Africans | 0.0 /100 | #277 | Tragic 83.2% |
| Immigrants | Cuba | 0.0 /100 | #278 | Tragic 83.2% |
| British West Indians | 0.0 /100 | #279 | Tragic 83.2% |
| Dominicans | 0.0 /100 | #280 | Tragic 83.2% |
| Immigrants | Dominican Republic | 0.0 /100 | #281 | Tragic 83.1% |
| Americans | 0.0 /100 | #282 | Tragic 83.1% |
| Immigrants | Azores | 0.0 /100 | #283 | Tragic 83.1% |
| Nicaraguans | 0.0 /100 | #284 | Tragic 83.1% |
| Belizeans | 0.0 /100 | #285 | Tragic 83.1% |
| Mexican American Indians | 0.0 /100 | #286 | Tragic 83.0% |
| Guyanese | 0.0 /100 | #287 | Tragic 83.0% |
| Ottawa | 0.0 /100 | #288 | Tragic 83.0% |
Demographics Similar to Cajuns by In Labor Force | Age 25-29
In terms of in labor force | age 25-29, the demographic groups most similar to Cajuns are Black/African American (82.6%, a difference of 0.060%), Blackfeet (82.6%, a difference of 0.060%), Central American Indian (82.4%, a difference of 0.15%), Immigrants from Central America (82.4%, a difference of 0.16%), and Immigrants from St. Vincent and the Grenadines (82.7%, a difference of 0.18%).
| Demographics | Rating | Rank | In Labor Force | Age 25-29 |
| Spanish American Indians | 0.0 /100 | #300 | Tragic 82.9% |
| Vietnamese | 0.0 /100 | #301 | Tragic 82.8% |
| Immigrants | Belize | 0.0 /100 | #302 | Tragic 82.8% |
| Immigrants | Grenada | 0.0 /100 | #303 | Tragic 82.8% |
| Immigrants | St. Vincent and the Grenadines | 0.0 /100 | #304 | Tragic 82.7% |
| Blacks/African Americans | 0.0 /100 | #305 | Tragic 82.6% |
| Blackfeet | 0.0 /100 | #306 | Tragic 82.6% |
| Cajuns | 0.0 /100 | #307 | Tragic 82.5% |
| Central American Indians | 0.0 /100 | #308 | Tragic 82.4% |
| Immigrants | Central America | 0.0 /100 | #309 | Tragic 82.4% |
| Osage | 0.0 /100 | #310 | Tragic 82.3% |
| Alaskan Athabascans | 0.0 /100 | #311 | Tragic 82.3% |
| Hispanics or Latinos | 0.0 /100 | #312 | Tragic 82.2% |
| Yaqui | 0.0 /100 | #313 | Tragic 82.2% |
| Cherokee | 0.0 /100 | #314 | Tragic 82.1% |